ValuentumAd

Official PayPal Seal

Worst in Energy Not Over, Stay Away from Leveraged Enterprises, Seeds of Financial Crisis Sown?

publication date: Mar 11, 2020
 | 
author/source: Valuentum Analysts

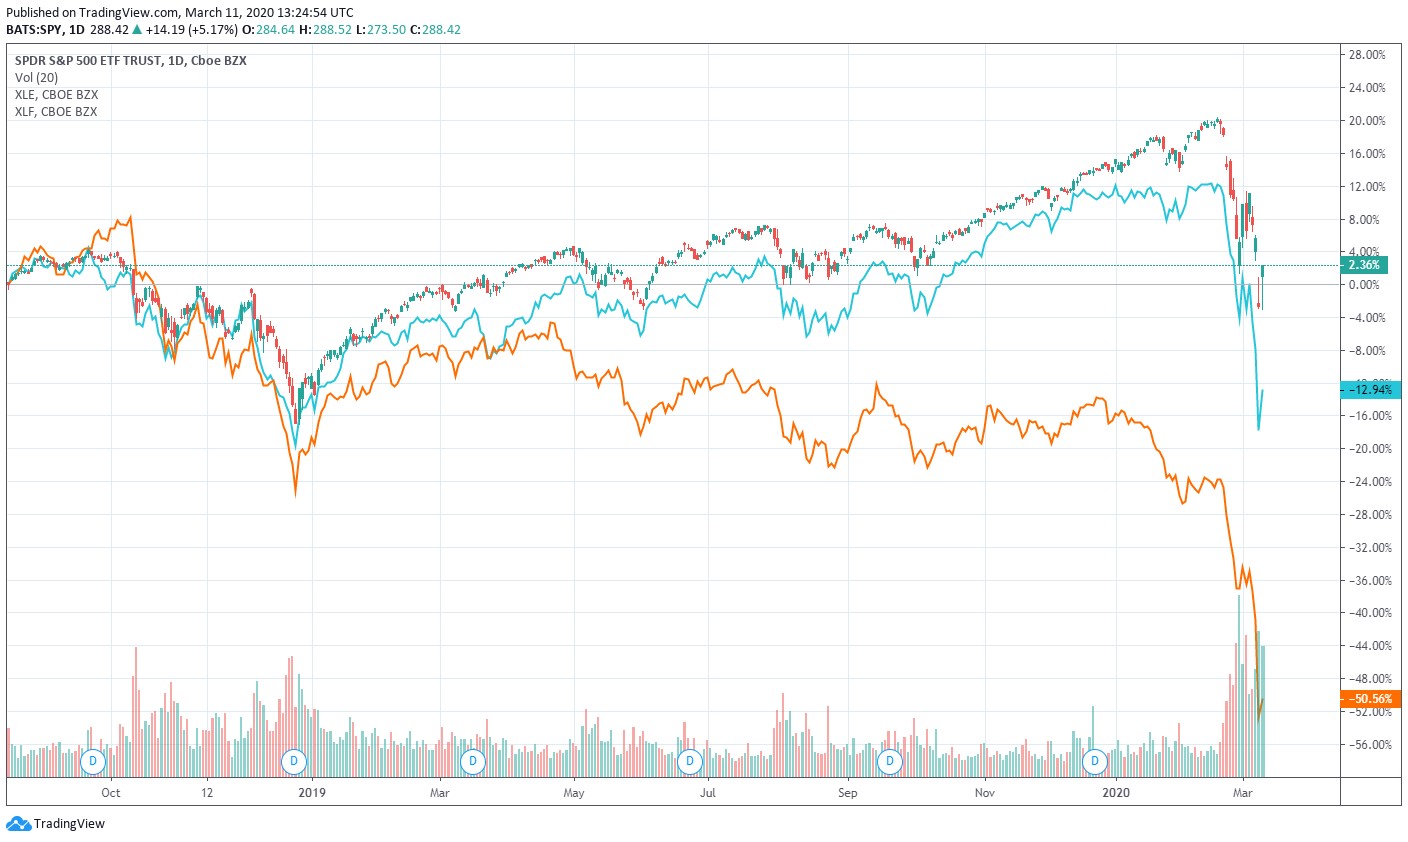
Image Shown: The energy and banking markets continue to be experiencing pain. Since we removed the Energy Select Sector SPDR (XLE) and Financial Select Sector SPDR (XLF) from the Best Ideas Newsletter portfolio and Dividend Growth Newsletter portfolio, the XLE has fallen more than 50% and the XLF has fallen 13%, while the SPY has held up roughly 2%. We continue to believe staying away from energy and financials/banks will be a source of significant alpha.

These are challenging times. The oil price swoon has complicated an already-dire situation with COVID-19. We’re seeing cracks in the credit markets, and the European banking system is far from healthy. The US banks may face knock-on impacts from energy loan defaults and hold significant counter-party risk from their European brethren, which have breached post-Lehman lows. We’re doubtful any fiscal stimulus will stave off this crisis, and it may just set up the markets for the next leg down, if Congress ends up in a stalemate. We will continue to keep our members informed on the state of global energy markets as more information becomes available, but we think avoiding energy and banks/financials will continue to be a source of alpha. We removed the XLE and XLF from the newsletter portfolios in August of last year. We’re reiterating our 2,350-2,750 target range on the S&P 500.

By Valuentum Analysts

In light of the historic rout in global oil prices witnessed on Monday, March 9, we received some questions from our members on the energy industry. In this note, we highlight four oilfield services companies with net cash positions, a quality downstream operator with a nice free cash flow profile and manageable net debt load, and two upstream operators which have managed to outmaneuver the “shale treadmill” and generate free cash flows.

However, before we get started, we reiterate that we don’t think the bottom across the energy complex is in, and we think many of the weakest energy credits will fold or seek restructuring as lenders reassess the capacity for loan repayment amid the oil price swoon. The reality is that more than 100 operators in the shale industry will now be losing money with new wells. Some estimates suggest that only Exxon (XOM), Occidental Petroleum (OXY), Chevron (CVX) and Crownquest “can turn profits at $31 a barrel.” The credit quality of the energy space practically changed overnight given the oil price war, and the situation remains dire.

The implications on the banking sector as a result of the oil price swoon is nothing to scoff at either. According to some estimates, the loan books of BOK Financial (BOKF), Cullen/Frost Bankers (CFR), Cadence Bancorporation (CADE), Comerica (CMA), and CIT Group (CIT) are among the most exposed as a percentage of total loans, suggesting investors should expect a significant increase in loan loss reserves across their books. The larger banks, including Bank of America (BAC) Citigroup (C), JPMorgan (JPM), and Wells Fargo (WFC) have comparatively smaller exposure to energy loans on their books, but that doesn’t mean we won’t see incremental loan loss reserves as well. Regionals such as U.S. Bancorp (USB) and PNC Financial (PNC) may also feel some pain, according to Odeon Capital. Our concerns across the banking sector continue to mount more generally as well, as net-interest-margin pressure increases due to lower rates (the Fed recently made an emergency 50 basis-point rate cut), and as a slowdown (or reversal) in loan and deposit growth seems more likely.

The oil price collapse comes at a terrible time for the banking sector, as COVID-19 wreaks havoc on Europe, particularly Italy (EWI). According to the latest situation report - 50, dated March 10, from the World Health Organization, there are now more than 113,000 confirmed cases of COVID-19 across the globe, with 32,700 confirmed outside of China (FXI, MCHI, KWEB) in nearly 110 countries. Italy tallied on another 1,797 cases and 97 new deaths from the day prior, and now lists over 9,100 total cases. The mortality rate of COVID-19 in Italy stands at 5%. It is nothing short of a catastrophe in Italy, and now all of the country is locked down (“quarantined”).

With US banks largely swooning as a result of the oil price collapse and expectations for reduced economic activity as a result of COVID-19, the combination could be the catalyst in Europe that triggers a financial crisis. For example, Goldman Sachs (GS) estimates that “European banks will see about 30 billion euros ($34 billion) erased from their net income over the next three years as a result of coronavirus.” During trading March 9, the European banks took out post-Lehman lows, hitting valuations of 0.45x of book value, showcasing a lack of confidence in loan repayment among the crisis. Shares of Deutsche Bank (DB), Santander (SAN), Credit Suisse (CS), UBS (UBS), ING (ING) and BBVA (BBVA) were walloped.

The Dividend Cuts Begin

Occidental Petroleum just slashed its payout, risk that was highlighted via the company’s Dividend Cushion ratio of 0.2 (any ratio below 1 suggests a risky payout, and OXY’s was practically near 0). OXY’s shares have fallen to the teens from a 52-week high of nearly $70 (it holds a tremendous amount of debt due to deal making), and we reiterate our view that the most highly-leveraged companies will face among the worst declines as COVID-19 looks to eventually turn into a financial crisis. OXY may be the first of many oil companies to slash their dividends, as oil companies reevaluate risks and seek to preserve capital. Few energy-related companies were ready for this oil price shock. Here’s how the credit rating agencies were framing the situation, before the oil-price crash the past couple days:

With a "staggering" $86 billion in debt coming due in the next four years, North American oil and gas producers — particularly pure-play natural gas drillers — are at a higher risk of default as the credit window slams shut amid low commodity prices, credit rating agency Moody's said Feb. 19.

Bond investors got burned once in the oil price crash of 2015 and are not eager for a repeat, Moody's said. "Creditors now demand higher risk premiums to be compensated for the producers' elevated commodity-price risk, uncertainty around their future cash flow, and growing public and governmental efforts to limit the use of fossil fuel globally."

Investment grade debt accounts for 38% of the total but is front-loaded into the first three years, while weaker, more speculative grade maturities lie further out on the timeline, giving riskier companies more time to repair their balance sheets with asset sales and other measures, Moody's said.

Even many of the largest players have been significantly wounded from the late 2015/early 2016 energy price collapse, and they floated debt to survive that calamity. The balance sheets of many are just not ready for this "fight," and many were counting on a more-stable environment to recover from the fallout just 5 years ago now. We would not be surprised if some of the largest oil players slash their payouts, particularly if oil prices continue to hover around these levels. Based on their respective Dividend Cushion ratios, the financial health of Chevron (CVX) and ConocoPhillips (COP) look comparatively stronger than the payouts of Exxon and Royal Dutch Shell (RDS.A, RDS.B).

When BP plc (BP), a High Yield Dividend Newsletter portfolio holding, files its annual report for 2019, we’ll have more to say on the name. For now, given BP’s extensive downstream and petrochemical operations along with its more lucrative (when raw energy resources pricing is subdued) international upstream operations, expected reductions in legal liability payouts relating to the Gulf of Mexico disaster, solid operational execution of late, and its quality cash flow profile, we aren’t panicking. However, no energy-tied payout may be completely safe in this environment given the shock the past few days.

Perhaps a more straightforward situation than the largest oil players with deeper pockets, we believe the midstream energy industry may be most exposed to a continuation of the trend of more distribution cuts. During the midstream MLP bubble of late 2014/early 2015, investors had ignored growth capital spending within the enterprise valuation construct to calculate intrinsic value, instead using DCF ("distributable cash flow") multiple analysis to value units ("distributable cash flow" should not be viewed in the valuation context because it ignores a key cash outflow in the form of growth capex). This has since changed given the swoon in midstream MLP (AMLP) prices of late. [The ETF that tracks the prices of MLP midstream companies, for example, hit a 52-week low at $4.14 this week, down from $10+, its 52-week high.] For MLPs, investors are now considering all growth spending in the enterprise valuation construct, not just maintenance or sustaining capital expenditures.

During the past five years or so, there have been over 110 distribution cuts in the energy MLP space, and we expect even more. For starters, most midstream energy MLPs still do not cover distributions with traditional free cash flow (as measured by cash flow from operations less all capital spending), and as credit markets tighten, we would expect most to hunker down and/or cut the distribution to shore up capital. The financial health of customers of midstream MLPs are also weakening, too, and this could have further implications across the midstream space, particularly in the event of any seeking Chapter 11 restructuring, which almost certainly would require contract renegotiations. The outsize yields on many midstream MLPs (15%+) may very well be “fantasy,” so please be careful. Investors should not value equities on the basis of their dividend yield. Read Value Trap.

We’re maintaining our S&P 500 target range of 2,350-2,750, which was breached recently, and our favorite ideas are always included in the Best Ideas Newsletter portfolio, Dividend Growth Newsletter portfolio, High Yield Dividend Newsletter portfolio and the Exclusive publication. Look there for ideas first and foremost. We removed the Energy Select Sector SPDR ETF (XLE) and the Financial Select Sector SPDR (XLF) in August of last year, a timely move to rid the newsletter portfolios of meaningful energy and banking exposure prior to this swoon. We think avoiding energy and banking entities will remain a source of alpha in the coming periods, and we are skeptical that any fiscal stimulus package will stave off this crisis (if a package is rejected by Congress, it could set up the markets for the next leg down).

We’re not big fans of energy or banks/financials at this point, but… 

If You Must Own Energy – Where to Hide?

Oilfield Services

As it relates to the oilfield services industry, we’ve located four names that have net cash positions (as of the end of 2019); however, their free cash flow profiles vary considerably.

Dril-Quip Inc (DRQ) exited 2019 with $399 million in cash on hand versus no short- or long-term debt, allowing for a nice net cash position. The firm’s free cash flows have shrunk substantially since 2017, falling from $80 million down to just $3 million in 2019.

Franks International NV (FI) exited 2019 with $195 million in cash on hand and no short- or long-term debt, good for a nice net cash position. However, the firm generated negative free cash flows in both 2018 and 2019.

TechnipFMC Plc (FTI) exited 2019 with $5.2 billion in cash on hand versus $0.5 billion in short-term debt and $4.0 billion in long-term debt, good for a modest net cash position. The firm generated $0.4 billion in free cash flow in 2019, however, please note TechnipFMC was not free cash flow positive in 2017 and 2018.

Tenaris SA (TS) exited 2019 with ~$1.55 billion in cash on hand versus ~$0.05 billion in short-term debt and just under $0.8 billion in long-term debt, allowing for a decent net cash position. The firm’s free cash flows improved materially in 2019, coming in at almost $1.2 billion versus less than $0.3 billion in 2018 and please note Tenaris generated negative free cash flows in 2017.

Out of these four names, Tenaris looks the most interesting given its improving free cash flow profile and meaningful net cash position. That said, Tenaris is a major supplier of tubular equipment to the upstream side of the oil & gas industry. We caution that material reductions in upstream capital expenditures, and the related reductions in drilling & completion activity, will negatively impact its performance in the near- to medium-term.

Tenaris yields ~8.1% as of this writing (its annual dividend obligations stood at just below $0.5 billion in 2019) which reflects the uncertainty investors have in its outlook. It won’t be until there’s a stabilization in energy markets that Tenaris will have certainty on a forward-looking basis; however, its nice net cash position and quality free cash flow profile offers some room for protection.

[As of this writing, Tenaris’ Dividend Cushion ratio stands near 2.3x due to its pristine balance sheet, but when we update our valuation for implications of the recent oil price swoon, that will come down due to pressures facing its forecasted free cash flows.]

Downstream

HollyFrontier Corp (HFC) is a downstream company that primarily owns refineries and the related midstream assets that support those endeavors. Holly Energy Partners L.P. (HEP) is HollyFrontier’s master limited partnership (‘MLP’) midstream spinoff which HollyFrontier retains a sizable economic stake in. At the end of 2019, HollyFrontier had $0.9 billion in cash on hand on a consolidated basis versus $2.5 billion in total debt (the firm did not have any short-term debt as of the end of 2019) on a consolidated basis.

While its midstream spinoff was responsible for a large portion of that long-term debt load and a negligible portion of the cash position, it’s worth keeping the whole picture in mind. On a consolidated basis, HollyFrontier generated ~$1.25 billion in free cash flow in 2019 and has consistently been very free cash flow positive from 2017-2019 (annual free cash flows averaged ~$1.05 billion during this period). Within the downstream space, HollyFrontier is one of the more interesting firms, and we view its net debt load as manageable. From 2017-2019, HollyFrontier’s annual dividend obligations averaged just under $0.25 billion and its annual distributions to noncontrolling interests averaged just over $0.1 billion on a consolidated basis.

Looking ahead, HollyFrontier’s outlook is brighter than that of the four aforementioned oilfield services companies. Its refineries cater to major US demand centers and are well-positioned to access low-cost sources of domestic oil supplies. While its MLP midstream spinoff Holly Energy Partners will likely face pressure from the decline in domestic upstream development, HollyFrontier is somewhat removed from those problems (Holly Energy Partners’ gathering & processing operations, for example, may face material hurdles over the medium-term). Holly Energy Partners’ total debt of $1.5 billion at the end of 2019, offset by a negligible amount of cash, is non-recourse to HollyFrontier.

The downstream company is investing in a renewable diesel project which is expected to come online by the first quarter of 2022. That project is being developed at its Navajo Refinery which has the capacity to process 100,000 barrels of crude per day. HollyFrontier is adding a renewable diesel unit (‘RDU’) to the complex with the ability to process 9,000 barrels equivalent of soybean and other feedstocks per day, keeping in mind the economics of this endeavor are dependent in part on where renewable identification numbers (‘RINs’, which were created as part of the Renewable Fuel Standards program, a product of the Energy Policy Act of 2005 and the Energy Independence and Security Act of 2007) are trading at (more recently, the price of RINs have been subdued). Once operational, this facility will be able to produce ~125 million gallons of renewable diesel per year for a projected development cost of ~$350 million.

Upstream

From 2017 to 2019, Cabot Oil & Gas (COG) generated just under ~$0.35 billion in free cash flows on average per year. Its annual dividend obligations averaged a tad north of $0.1 billion during this period and came in at ~$0.15 billion in 2019. Last year, Cabot Oil & Gas generated ~$0.65 billion in free cash flow, largely because the firm exited the Eagle Ford shale play (a liquids-rich play) and dedicated itself to the very prolific natural gas-rich Marcellus shale play in Pennsylvania.

Cabot Oil & Gas is now a pure natural gas producer (100% of its output was “dry” natural gas in 2019, as compared to oil or natural gas liquids); however, considering how natural gas prices are quite low right now, we caution this name comes with a fair amount of risk. Furthermore, at the end of 2019, the company had a net debt load of $1.0 billion.

We also warn that Cabot Oil & Gas is highly-leveraged to the performance of domestic natural gas pricing in the US, and we covered why the outlook for domestic natural gas prices is poor in this note here. As of this writing, Cabot Oil & Gas’ Dividend Cushion ratio sits at 1.5x; however, as with Tenaris, we caution that could change materially during our next model update cycle.

Pivoting now to EOG Resources Inc (EOG), an upstream producer (which tends to focus more so on liquids-rich endeavors involving crude oil) generated ~$1.75 billion in free cash flow in 2019, and from 2017-2019, its annual free cash flows averaged $1.2 billion. Its annual dividend obligations averaged just under $0.5 billion during this period, coming in at just below $0.6 billion in 2019.

Inclusive of short-term debt, EOG Resources exited 2019 with ~$3.15 billion in net debt. We caution the firm is highly levered to changes in raw energy resources pricing, particularly for liquids. As of this writing, EOG Resources carries a Dividend Cushion ratio of 1.6x, which could change during our next update cycle.

Concluding Thoughts

These are challenging times. The oil price swoon has complicated an already-dire situation with COVID-19. We’re seeing cracks in the credit markets, and the European banking system is far from healthy. The US banks may face knock-on impacts from energy loan defaults and hold significant counter-party risk from their European brethren, which have breached post-Lehman lows. We’re doubtful any fiscal stimulus will stave off this crisis, and it may just set up the markets for the next leg down, if Congress ends up in a stalemate. We will continue to keep our members informed on the state of global energy markets as more information becomes available, but we think avoiding energy and banks/financials will continue to be a source of alpha. We removed the XLE and XLF from the newsletter portfolios in August of last year. We’re reiterating our 2,350-2,750 target range on the S&P 500.

Oil & Gas (Majors Industry) – BP CVX COP XOM RDS.A RDS.B TOT

Independent Oil & Gas Industry – APA COG CLR DVN EOG MRO OXY PXD

Industrial Minerals - ARLP, CCJ, CNX, HCR, NRP

Refining Industry – HES HFC MPC PSX VLO

Oil & Gas Pipeline Industry – ENB ET EPD KMI MMP

Related: USO, BNO, ARMCO, XLE, XOP, VDE, AMLP, AMZA, KRE, KBE

-----

Valuentum members have access to our 16-page stock reports, Valuentum Buying Index ratings, Dividend Cushion ratios, fair value estimates and ranges, dividend reports and more. Not a member? Subscribe today. The first 14 days are free.

Callum Turcan does not own shares in any of the securities mentioned above. Kinder Morgan Inc (KMI) is included in Valuentum’s simulated Dividend Growth Newsletter portfolio. BP plc (BP), Enterprise Products Partners L.P. (EPD), and Magellan Midstream Partners L.P. (MMP) are all included in Valuentum’s simulated High Yield Dividend Newsletter portfolio. Some of the other companies written about in this article may be included in Valuentum's simulated newsletter portfolios. Contact Valuentum for more information about its editorial policies.

1 Comments Posted Leave a comment

Guest
 

Add a comment:

Sign in to comment on this entry. (Required)


-------------------------------------------------
The High Yield Dividend Newsletter, Best Ideas Newsletter, Dividend Growth Newsletter, Valuentum Exclusive publication, ESG Newsletter, and any reports, data and content found on this website are for information purposes only and should not be considered a solicitation to buy or sell any security. Valuentum is not responsible for any errors or omissions or for results obtained from the use of its newsletters, reports, commentary, data or publications and accepts no liability for how readers may choose to utilize the content. Valuentum is not a money manager, is not a registered investment advisor, and does not offer brokerage or investment banking services. The sources of the data used on this website and reports are believed by Valuentum to be reliable, but the data’s accuracy, completeness or interpretation cannot be guaranteed. Valuentum, its employees, and independent contractors may have long, short or derivative positions in the securities mentioned on this website. The High Yield Dividend Newsletter portfolio, ESG Newsletter portfolio, Best Ideas Newsletter portfolio and Dividend Growth Newsletter portfolio are not real money portfolios. Performance, including that in the Valuentum Exclusive publication and additional options commentary feature, is hypothetical and does not represent actual trading. Actual results may differ from simulated information, results, or performance being presented. For more information about Valuentum and the products and services it offers, please contact us at info@valuentum.com.