
Member LoginDividend CushionValue Trap
|
Efficacy of the Dividend Cushion Ratio
publication date: Nov 16, 2022
|
author/source: Valuentum Analysts
A version of this article was originally published September 2019.
The Dividend Cushion ratio is one of the most powerful financial tools an income or dividend growth investor can use in conjunction with qualitative dividend analysis. The ratio is one-of-a-kind in that it is both free-cash-flow based and forward looking. Since its creation in 2012, the Dividend Cushion ratio has forewarned readers of approximately 50 dividend cuts. We estimate its efficacy at ~90%. By Valuentum Analysts
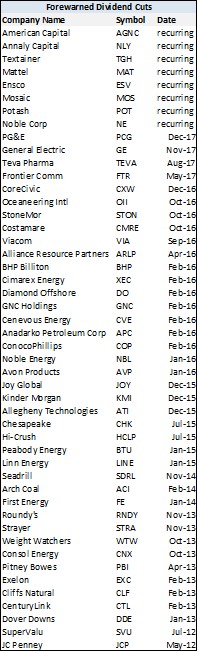
The Dividend Cushion ratio is a helpful tool to use to cushion your dividend growth or income portfolio against potential dividend cuts. The ratio also helps to assess the growth potential of a company’s dividend, above and beyond current expectations of payout expansion. Since the development of the Dividend Cushion ratio, it has forewarned of the dividend cuts of approximately 50 companies (meaning Valuentum members were well aware of the significant risk to these stocks’ dividends before they slashed them). Among some of the high profile dividend cuts were: StoneMor (STON), Mattel (MAT), Exelon (EXC), BHP Billiton (BHP), Kinder Morgan (KMI), ConocoPhillips (COP), General Electric (GE), Seadrill (SDRL), JC Penney (JCP), among dozens of others (see chart). At its core, the Dividend Cushion ratio is designed to provide the dividend growth investor and the income investor with a forward-looking, free-cash-flow based opinion of the strength and future growth potential of a company’s dividend. The ratio not only highlights risks associated with potential dividend cuts, but the ‘cushion’ behind the Dividend Cushion reveals just how much capacity a firm has to continue growing its dividend in the future, above and beyond existing expectations. The foundation behind the measure--assessing future free cash flows relative to future cash dividend payments in the context of a company’s balance sheet--remains as relevant as ever. The metric cannot be found anywhere else but at Valuentum--other research companies generally do not have systematic future forecasts of free cash flow like we do. The Dividend Cushion ratio is found within each company’s Dividend Report on their respective stock landing pages of our website. We update our Dividend Reports on companies regularly, and we encourage members to check the Dividend Cushion ratios on their income investments at least quarterly (in accordance with our update cycle). The Dividend Cushion ratio is not perfect. Though it has “caught” 50 or so dividend cuts in our coverage universe since creation, there have been a number that have slipped by. We estimate its rate of efficacy at just less than 90%. It’s also important to note that the Dividend Cushion ratio is only one factor we use in assessing the overall health of a company’s dividend. Business model and secular demand trends are very important qualitative considerations, too, as is information retrieved from market prices (e.g. an outsize yield could be foretelling of a cut in itself). Forewarning of Dividend Cuts What do StoneMor, Mattel, Exelon, BHP Billiton, Kinder Morgan, ConocoPhillips, General Electric, Seadrill, JC Penney, and the dozens of other companies included in the chart have in common? The Dividend Cushion ratio, a balance-sheet-aware, free-cash-flow based dividend analysis methodology, highlighted them as having significant dividend risk in advance of their respective dividend cuts. Said differently, due to a Dividend Cushion ratio below 1, and sometimes well below 0, Valuentum members were aware of the high risk of the dividend cut in advance. Readers have been aware of the preliminary statistical backtesting we’ve performed on the Dividend Cushion ratio, but the walk-forward evaluation beginning in 2012 has been equally impressive. We estimate the Dividend Cushion ratio’s efficacy--or the percentage of companies that cut their dividends that had a Dividend Cushion ratio less than 1 at the time of the cut--at just less than 90%. We think a ratio that compares a company’s future free cash flow generation to its future expected cash dividends after considering its capital structure is an extremely valuable tool. Though it is certainly not perfect, we think the Dividend Cushion ratio's track record continues to showcase the tremendous efficacy of a forward-looking, free-cash-flow based dividend methodology. For example, absent somewhat “misleading” guidance from management teams in the case of JAKKS Pacific (JAKK), deliberate moves by the board to not support the distribution or dividend in the case of Boardwalk Pipeline (BWP) and National Oilwell Varco (NOV), and the launching of an aggressive market share strategy and restructuring program in response to near-term weakness in the case of CECO Environmental (CECE)--very unusual cases--the Dividend Cushion has done extremely well in identifying the risks related to a dividend cut within our 1,000+ company coverage universe. It even picked up the risk associated with steady-eddy utility firms, Exelon and First Energy. In December 2017, it “caught” the dividend cut of PG&E (PCG), too. Dividend growth and income investors know that a dividend cut could be disastrous to their portfolios, as future income is not only reduced, but it is also very likely that capital is permanently impaired. A look at the price performance of a company after a dividend cut is quite telling. The Dividend Cushion ratio is designed to provide the income investor with an independent opinion--and one that is rooted in forward looking, free-cash-flow analysis--of the strength and future growth potential of a company’s dividend. It not only helps to identify tremendous financial risks that may lead up to a potential dividend cut, but it also estimates the ‘cushion’ to reveal just how much capacity a company has to continue growing its dividend into the future. Technically speaking, the Dividend Cushion ratio considers the company’s net cash on its balance sheet (total cash less long-term debt) and adds that to its forecasted future free cash flows (cash from operations less capital expenditures) over a five-year period and divides that sum by the company’s future expected cash dividend payments over the next five years. At its core, it tells investors whether the company has enough cash to pay out its dividends in the future, while considering its debt load (capital structure). If a company has a Dividend Cushion ratio above 1, it can cover its dividend, but if it falls below 1, trouble may be on the horizon. The Dividend Cushion ratio is found within each company’s Dividend Report on its respective stock landing page, which can be found using the ticker search function at the top right of Valuentum.com (in the header of the website). We update our Dividend Reports on companies regularly, and we encourage members to check the Dividend Cushion ratios on their dividend growth and income investments periodically. Even subtle changes could reveal the trajectory of dividend health. Walk-Forward Case Studies of the Dividend Cushion Ratio When we were developing the Dividend Cushion ratio, we scoured our stock universe for companies that had cut their dividends in the past to uncover the major drivers behind the dividend cut. This is what we learned: Among the major reasons why companies cut their dividend had to do with preserving cash in the midst of a secular or cyclical downturn in demand for their products/services or when faced with excessive leverage (how much debt they held on their respective balance sheets). Fundamental weakness often exacerbates financial (balance sheet) weakness, reducing or limiting cash available for dividends. This is why we focus so much on free cash flow and the balance sheet. We definitely learned a lot from the backtested work, but we’ve been monitoring the Dividend Cushion ratio on a walk-forward basis, too. Since its development in 2012, it has now cautioned against nearly 50 companies that have cut their dividends, revealing what we estimate to be efficacy of just shy of 90%. Let’s walk through a few case studies to get a better understanding of both the ratio and what types of risks are common with respect to companies that cut their dividends. We think it only makes sense that having the best understanding of some common characteristics of those companies that have cut their dividend/distribution in the past may help readers avoid a potential disappointment in their own portfolio in the future. Example #1: CenturyLink “A case of too much debt.” From CenturyLink’s press release dated February 13, 2013: “In connection with the new repurchase program, the board also indicated its intention to revise the company's quarterly dividend rate to $0.54 from $0.725 per share. The board expects to approve this new rate at its next regularly-scheduled meeting on February 26, 2013, with the change effective with the March 2013 quarterly dividend payment. CenturyLink also expects to utilize a portion of its free cash flow generated in 2013 and 2014 to repay debt and maintain leverage at less than 3.0 times EBITDA (earnings before interest, taxes, depreciation and amortization).” Example #2: Exelon “Concern over balance sheet, leverage” From the analyst note, released February 8, 2013: “In its fourth-quarter earnings presentation slide deck, Exelon announced that it would slash its quarterly dividend payout to $0.31 per share (was $0.525 per share) beginning in the second quarter of 2013. Valuentum members were well aware of the elevated risk of the dividend cut long before it became apparent to the market. Our July 2012 dividend report on Exelon, for example, revealed a 0.3 Dividend Cushion ratio, and our October 2012 dividend report revealed a -0.1 Dividend Cushion ratio. Any Dividend Cushion ratio below 1 indicates that there is significant risk with respect to the long-term sustainability of a company's dividend. Example #3: Cliffs Natural “Declining demand and weak free cash flow” From our analyst note, released February 2013: "After we predicted a dividend cut in November 2012, Cliffs Natural Resources finally cut its dividend after posting poor results for 2012. The firm slashed its quarterly payout 76% to $0.15 per share…Results for Cliffs were actually a bit better than consensus estimates on both the revenue and earnings side. Total revenue declined 4% year-over-year to $1.5 billion, while earnings dipped 59% year-over-year to $0.62 per share (after adjusting for a $1 billion goodwill impairment). Free cash flow for the year was incredibly weak, falling to a negative $613 million, explaining why the dividend needed to be cut… …If we only took into account the payout ratio, Cliffs’ adjusted earnings per share of $3.45 for 2012 would seem to give the dividend ample cushion (its prior annual dividend payout was $2.50 per share, an adjusted payout ratio of 72.5%). However, Cliffs is a perfect example of the significant and potential tragic pitfalls of using the payout ratio as a measure of dividend safety and why the Dividend Cushion is one of the most important metrics for income investors to use to safeguard their portfolios from dividend-growth blow-ups." Example #4: General Electric “Weakened free cash flow, elevated leverage following portfolio transformation” From our note, “GE Cuts Guidance, All Eyes Turn to November 13,” released October 2017: “The culmination of these developments has caused new CEO John Flannery to embark on additional asset sales, and he plans $20+ billion in business exits over the next one to two years. Such proceeds will likely be necessary in shoring up the balance sheet and providing a potential bridge to more normalized levels of cash flow generation for the company. Flannery has told investors to think of 2018 as a “reset year,” but is confident that his team will be able to cut costs significantly moving forward. ... The most prudent course of action for Flannery, beyond reigning in unnecessary corporate spending, may be cutting the dividend and putting an end to the firm’s massive share buyback program.” As GE works to focus on its roots as an industrial bellwether in the areas of aviation, power, and healthcare, the company experienced a material drop off in free cash flow generated by its industrial portfolio, an impact that was exacerbated by the recent divestitures of its financial assets, meaning it would no longer receive sizable dividend checks from GE Financial. A poorly-timed move with respect to its tie-up with Baker Hughes linked its near-term fortunes to the health of energy resource pricing as well as added material leverage to the balance sheet, two characteristics we are not particularly fond of in our income ideas. We had viewed the planned asset divestitures of $20+ billion as management’s efforts to further shore up its financial position, which had deteriorated materially of late due in part to the massive annual cash dividend obligations of recent years. However, in shoring up liquidity, GE shrank its business too much, making it difficult to reasonable sustain the payout with ongoing operations. GE was also forced to cut its payout during the Great Recession, suggesting it may not have been simply a one-time offender of mismanaging capital (even if the company has been prone to some major bad luck/timing during the past decade). The Dividend Cushion ratio had warned readers in advance of GE's 2017 dividend debacle. Example #5: Teva Pharma “A poorly-timed, debt-fueled acquisition” Teva Pharma’s dividend cut is tied, at least in part, to its decision to purchase Actavis Generics at the height of the generic drug market in August 2016 for $40+ billion. The purchase has now proven to be a bust, and Teva’s debt-laden balance sheet was too much for its business to handle, especially after considering the competitive and regulatory pressures it continues to face. We weren’t too happy about Teva being a “best idea” in the past, but the Dividend Cushion told us to “get out” before things really got bad with the share price. Prior to its dividend cut, Teva’s Dividend Cushion ratio had been -0.4 in November 2016 and -1 in February 2017. The following is from the note, “Generic Drug Price Deflation Continues to Weigh on Shares of Teva,” which came just after the dividend cut was announced but still is great at explaining the issues facing the business: “The management team laid out a plausible scenario during its second-quarter conference call where Teva’s debt-to-equity ratio may exceed its debt covenants, and the persistent drug deflation coupled with the unknown entrant of a generic competitor for Copaxone has raised this possibility. It is our opinion that Teva needs to reduce costs aggressively and pay down some of its enormous debt load to give the new CEO ample opportunity to enact a turnaround.” Example #6: StoneMor Partners “A distribution backed by unsustainable access to capital markets” Here’s what we had to say about StoneMor’s distribution prior to the reduction in its payout in its dividend report: Key Strengths There’s nothing that any bullish (optimistic) holder of Stonemor’s units could ever say to make us feel comfortable with an investment in the MLP. Its free cash flow is insufficient, and its balance sheet is “buried” under a significant amount of debt. The MLP is incredibly capital-market dependent and has used the issuance of new units (equity) to fund operating cash flow shortfalls to keep its distribution “alive.” In the past three years alone, Stonemor has issued ~$290 million in new equity (dilution). The company’s personal care trust funds are tied to market activity, and its pre-need business causes severe business cash-flow imbalances. Stonemor’s distribution may not make it through the most difficult times. Potential Weaknesses We’re going to call it how it is: Stonemor’s distribution is far from safe. The master limited partnership (MLP) business model is one that we’re not particularly fond of, and while some investors are comfortable with the term distributable cash flow, we are not. We prefer the traditional measure of free cash flow when evaluating the health of a payout, and Stonemor’s cumulative free cash flow generation during the past three years (2013-2015) of ~$5.3 million is a mere fraction of its cash distributions paid over the same time period ($190+ million). Long-term debt of ~$640 million relative to a negligible cash balance of $15 million should send income investors running for cover. We’d be scared “to death” holding Stonemor for income purposes. This reminds us -- Please be sure to also evaluate the entirety of our dividend analysis prior to coming to a conclusion on our opinion of any stock. There is a tremendous amount of information in our two-page dividend reports alone that can help assess the risks of dividend cuts and potential-related capital erosion. We also provide 16-page reports and associated commentary from time to time, where applicable. Example #7: Frontier Communications “An over-leveraged balance sheet in a capital-intensive industry” Prior to its dividend cut, Frontier had a starkly negative Dividend Cushion ratio, driven by its large net debt position and less-than-ideal free cash flow generation given its level of financial leverage. We tend to avoid highlighting telecom companies as income ideas for those very reasons; most hold a significant amount of debt and are forced to spend big on capital each year to maintain operations. From the company’s first-quarter 2017 earnings report, which housed its dividend cut announcement: “Frontier Communications Corporation today reported its first quarter 2017 results, and announced that the Board of Directors has revised the Company's capital allocation strategy, which includes a reduction in the quarterly dividend to $0.04 per share, to enhance financial flexibility and achieve a targeted leverage ratio of 3.5x by year-end 2021, down from the current ratio of 4.39x.” Dan McCarthy, President and CEO of Frontier Communications, went on to say, "Our Board regularly reviews the Company's long-term capital allocation strategy, and it has determined to reduce the dividend at this time to provide additional financial flexibility, while still returning a meaningful cash dividend to shareholders. As we continue to execute on our strategy to deliver on the full potential of our strong assets and generate additional cash flow, we will optimize our capital allocation to ensure we strike a balance between investing in the business, paying down debt and returning capital to shareholders." Example #8: Potash Corp “Declining free cash flow from a commodity price taker” Potash Corp had cut its dividend twice in an approximately six-month period as it watched prices in the global potash market collapse. Though most commodity producers are cautious, by the very nature of volatile commodity prices, the health of their respective dividends are greater than most. In Potash’s case, the global potash market lost its oligopolistic characteristics earlier this decade following the disbanding of one of the two major cartels in the market during 2013. What followed was a battle for market share that ultimately led to significant over supply and material price pressures potash and other crop nutrients. Potash Corp felt the brunt of the impact, but the reduction in the payout was far from a blindside hit for Valuentum members as Potash’s notable debt load and declining free cash flow generation was accurately highlighted by its poor Dividend Cushion ratio. The Valuentum Dividend Cushion Is a Valuable Dividend Investing Tool Dividend growth and income investors have a lot to analyze, but we don’t think anything quite comes close to the effectiveness and simplicity of the Dividend Cushion ratio. Though the ratio is not a perfect indicator, the foundation behind the measure--assessing free cash flows relative to cash dividend payments in the context of a company’s balance sheet--remains as relevant as ever. The up-to-date metric cannot be found anywhere else, as other research firms generally do not calculate systematic future forecasts of free cash flow like we do. To stay on top of companies at risk of a dividend cut, please be sure to pay attention to the Dividend Cushion ratio and corresponding commentary within the dividend report and on the website. ----- Valuentum members have access to our 16-page stock reports, Valuentum Buying Index ratings, Dividend Cushion ratios, fair value estimates and ranges, dividend reports and more. Not a member? Subscribe today. The first 14 days are free.
----- Now read about the few instances where the Dividend Cushion ratio was "wrong" here. Related dividend ETFs: SDY, SCHD, VYM, VIG, DGRO, HDV |


 Key Takeaways: