
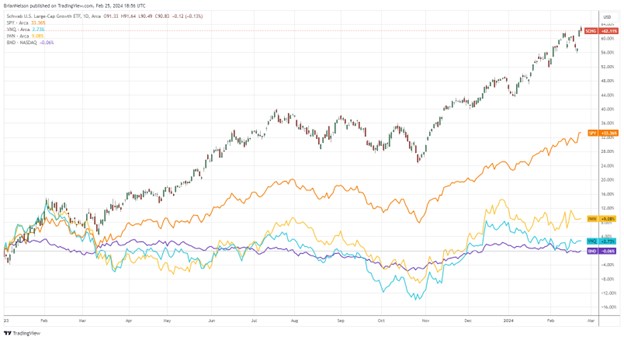
Image: Large cap growth stocks have trounced the performance of the S&P 500, REITs, and bonds since the beginning of 2023. We expect continued outperformance in this area of the market.
By Brian Nelson, CFA
We’re now roughly four years past the depths of the COVID-19 meltdown, where equities collapsed in February and March of 2020. As the markets began to recover through 2020, our long-term conviction in equities only grew stronger. We think the biggest risk for long-term investors remains staying out of the market on the basis of what could be considered stretched valuation multiples. As we outlined heavily in the book Value Trap, valuation multiples hardly tell the complete story about a company and often omit key long-term earnings growth, cash flow dynamics, and balance sheet health considerations. We remain bullish on equities for the long haul, and we think the next couple years will be incredibly strong. Our best ideas can be found in the Best Ideas Newsletter portfolio, Dividend Growth Newsletter portfolio, High Yield Dividend Newsletter portfolio, ESG Newsletter portfolio, and via the Exclusive publication as well as options idea generation.
At Valuentum, we place a heavy emphasis on discounted cash-flow valuation, also called the DCF valuation model. The DCF valuation model primarily focuses on two characteristics of a company: net cash on the balance sheet and future expected free cash flows. Think of valuation not in terms of a P/E ratio or EV/EBITDA multiple, but rather in the context of a company’s cash-based sources of intrinsic value. Let’s relate to personal finance to illustrate. Let’s say you have $1 million in cash at the bank, no liabilities, and you generate $50,000/year in residual earnings after annual expenses. This can be likened to a company that has $1 million in net cash on its balance sheet and generates $50,000/year in future expected free cash flow. The more net cash one has in the bank and the more one generates in earnings more than expenses, the higher net worth one is poised to have. For companies, it’s the same dynamic. As those future expected free cash flows are discounted back and added to a company’s net cash, the higher the company’s intrinsic value. Valuation multiples can sometimes lead investors away from the core building blocks of intrinsic (DCF) valuation.
As of the latest tally, S&P 500 companies are trading at ~20.4x forward 12-month estimated earnings, according to FactSet, which is above their 5-year (19x) and 10-year averages (17.7x), but earnings growth is expected to be quite robust in the coming years. According to FactSet, S&P 500 calendar year bottom-up earnings for the S&P 500 are targeted at 243.29 in calendar year 2024 and 275.35 in calendar year 2025. At 20x 2025 calendar year expected earnings, the S&P 500 could garner an optimistic price target in the next 6-12 months of ~5,500 (it closed at ~5,089 on Friday). Much could be said that a 20x multiple may be too high, but we’re seeing tremendous fundamental strength across the tech and communications sectors. Earnings growth out of most of the Magnificent 7 has been fantastic, with Nvidia (NVDA) and Meta Platforms (META) leading the charge, and we see no signs of this group’s pace of earnings expansion slowing. Apple (AAPL) put up all-time record quarterly earnings per share in its most recent quarter, while Microsoft’s (MSFT) and Amazon’s (AMZN) free cash flow performance have been top notch. These entities remain net-cash-rich, free-cash-flow generating secular growth powerhouses.
Since Valuentum was founded more than a decade ago, the markets, in my opinion, have become more efficient, even though they may be far from perfectly efficient in the most stringent definition. What I’m trying to say is that it’s very likely that a company that has a lower-than-market multiple P/E ratio likely deserves it, while the same may be said about a company’s higher-than-market multiple P/E ratio. The company with a lower-than-market multiple P/E ratio may be saddled with a huge net debt position, while its dividend obligations may be absorbing most of its free cash flow. For these types of companies, a low P/E ratio may be warranted. On the other hand, for companies that have huge net cash positions on their balance sheets and are generating considerable amounts of free cash flow, a high P/E ratio may be warranted. It’s far more probable this day and age that companies with low P/E ratios are value traps, while those with elevated P/E ratios have strong secular growth trends backing their excellent balance sheets and future expected free cash flow trajectories. Had investors focused solely on what we would describe as so-called value stocks the past few years, they would have been left behind. Only when the cash-based sources of intrinsic value within the DCF are considered can a determination about valuation be made.
As we wrote extensively in the book Value Trap, there is much less discretionary trading today than there was a number of years ago, but that doesn’t mean that price-agnostic trading will immediately spell a market crash lower. Quite the opposite may be equally as likely, and perhaps more so, as price-agnostic investors tend to buy anything at any price, as in the case of indexing. We’re seeing this dynamic play out in the largest of companies today, as index investors continue to plow money into broad-based indices driving the highest-weighted names in the indices even higher. That said, however, the strongest large cap growth names have tremendous cash-based sources of intrinsic value, as measured by their net cash positions and the strong future free cash flows that we expect them to generate. In some ways, the market is getting things “right” today, even if many index investors may be playing their hands blind, so to speak. Fundamentals support strong large cap growth performance and so does the increasing trend in price-agnostic trading. It should be no surprise why large cap growth has done so well against other styles of investing the past few years, and we expect this outperformance gap to continue.
Let’s now talk the U.S. economy. For starters, unemployment rates and trends in wage gains remain robust, and this backdrop is yet another reason why markets have a solid foundation, given that workers have funds to continue plowing money into retirement savings. Consumers are house rich and have fantastic balance sheets, too, with median home prices advancing considerably the past few years and equity markets reaching new heights. A look a nominal U.S. GDP shows an economy that has come roaring back from what was just a minor blip in the long-term trend of expansion higher during the COVID-19 scare. Not only this but we think the Fed once again has the stock market’s back and will likely begin cuts sooner than later in the event that inflation remains under control. What’s more, some are estimating that the market for artificial intelligence [AI] applications is huge (I’ve seen it estimated at ~$2 trillion by 2030). Though making historical analogs is a classic no-no when it comes to investing, which is almost entirely forward looking by nature, we may very well be in 1995 with years of market gains ahead of us before what may be a reckoning. We still believe we’re in the Roarin’ 20s, and we’ve said as much for some time now. This bull market may still be in its early days.
Happy investing!
NOW READ: 12 Reasons to Stay Aggressive in 2024
NOW READ: 2023 Was a Fantastic Year! Are You Ready for 2024?
———-

Tickerized for holdings in the SPY.
Brian Nelson owns shares in SPY, SCHG, QQQ, DIA, VOT, RSP, and IWM. Valuentum owns SPY, SCHG, QQQ, VOO, and DIA. Brian Nelson’s household owns shares in HON, DIS, HAS, NKE, DIA, RSP, SCHG, QQQ, QQQM, and VOO. Some of the other securities written about in this article may be included in Valuentum’s simulated newsletter portfolios. Contact Valuentum for more information about its editorial policies.
Valuentum members have access to our 16-page stock reports, Valuentum Buying Index ratings, Dividend Cushion ratios, fair value estimates and ranges, dividend reports and more. Not a member? Subscribe today. The first 14 days are free.