

Image Source: Jeffrey Beall
By Brian Nelson, CFA
We often talk about certain areas of the market such as large cap growth and small cap value. One of the big takeaways of the book Value Trap is that it explains that there are not really growth or value stocks, but rather there are only undervalued, fairly valued, and overvalued stocks determined on the basis of a price-versus-fair value consideration. This will always be true. Each company is different, and no company can be distilled into a simple price-to-earnings (P/E) or price-to-book (P/B) metric to determine the attractiveness of its valuation.
For example, a company with a low P/E can be overvalued because the market is missing its huge net debt position (net debt is a reduction to enterprise value to arrive at equity value), while a company with a high P/E can be undervalued because the market is underestimating its long-term free-cash-flow growth prospects. Only when a company’s share price is compared to an estimate of its discounted cash-flow based intrinsic value can investors discern whether a company is undervalued, fairly valued or overvalued.
That said, at times, there are certain groupings of stocks that just fit the mold of greatness. These stocks have tremendous net cash positions on the balance sheet, strong future expectations of free cash flow, and secular growth prospects. Their cash-based sources of intrinsic value are phenomenal, and they have enough excitement surrounding them where future expectations of their free cash flow can surprise to the upside. For years, this area has been large cap growth.
Quantitative analysts have studied historical data, and more generally, have concluded that small cap value has done the best. However, most of these studies include data that pre-dates the Internet when companies such as Eastman Kodak and Sears & Roebuck dominated the business landscape. Unfortunately, as businesses have evolved to be capital-light subscription-based entities, the measures used to support these historical studies, including price-to-book, have become less relevant in today’s analysis.
For one, it doesn’t make much sense to use data that pre-dates the founding of advertising giant Alphabet (GOOG) in 1998 or electric-vehicle maker Tesla (TSLA) in 2003. Investors that believed these historical studies about small cap value, which include data from the 1930s, have suffered tremendously the past decade or so. Since late 2009, for example, the inception of the Schwab U.S. Large-Cap Growth ETF (SCHG), the SCHG has outperformed the iShares Russell 2000 Value ETF (IWN) by nearly 300 percentage points. That’s the difference between having ~$231,460 and ~$524,780 with a $100,000 investment. The spread is not small potatoes, in our view–and this type of value-versus-growth analysis is the foundation of quant analysis. It’s what factor investing has been built upon.
When will ‘they’ learn that past is simply not prologue, and future expectations determine today’s stock prices? The future expectations of “yesterday” will always be different that the future expectations of “tomorrow.” We can’t just look at history to determine the future. Heading into 2022, many financial advisors had tunnel vision on the 60%/40% stock/bond portfolio. Influencers staked their reputation on the success of this simple strategy. But not only did rising interest rates pummel stocks during the year, they also pummeled bonds to the point where the 60%/40% stock/bond portfolio tumbled by a double-digit percentage in 2022.
Many retirees seemingly continue to be enamored by the siren song that is a 9%-10%+ dividend yield, too. Though investors can achieve this type of income stream for some time (it’s easy to find stocks with these types of yields), doing so often comes at the expense of maximizing wealth and the longevity of their retirement savings. For example, since late 2010, ETFs that track a basket of high-yielding energy MLPs (AMLP) and a basket of high-yielding mortgage REITs (REM), respectively, have fallen by 50% and 63%, respectively. Many are now caught in what can best be described as a ‘yield death spiral,’ requiring a higher and higher annual dividend yield as their capital base continues to be eroded by unsustainable dividend payments.
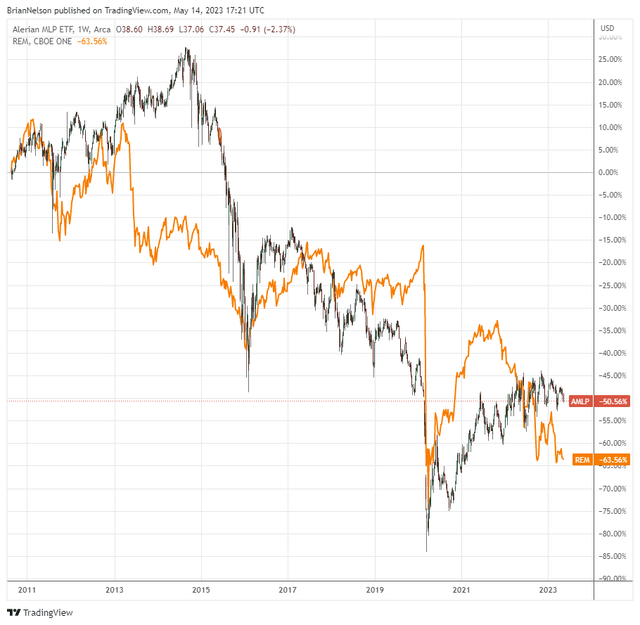
Image: Energy master limited partnerships and mortgage REITs have destroyed the accounts of retirees, necessitating them to chase higher and higher yields as their capital positions have eroded.
In some ways, the dividend, itself, is quite deceptive.
While a retiree’s income may grow if these 9%-10%+ yielders raise their payouts, the higher income stream just comes more and more at the expense of their capital positions, which are sometimes and likely continuously eroding. The math is simple: When a dividend or distribution is paid, the entity’s share price is adjusted down by the amount of the dividend payment, reducing the capital position of the investor. Investors already own the dividend as part of the stock price (their capital position) before it is paid. The dividend is not incremental, but rather a part of capital appreciation that would have occurred had the dividend not been paid.
There are no free ‘income’ lunches.
This is why some investors don’t use dividends in their approach to retirement at all. They can sell off some of their equity in the same manner that a dividend-income investor’s capital position is weighed down over time by the payment of a dividend. Their focus instead is on continuously growing their capital base such that they can maximize their total return, and therefore, the total distributions to them during their golden years.
To each their own, of course. It’s not for us to say what is right for you. With small cap value underperforming large cap growth for some time now, the 60%/40% stock/bond portfolio dropping considerably in 2022 (as predicted in the second edition of Value Trap), and the Dividend Growth Newsletter portfolio and Best Ideas Newsletter portfolio not only beating the S&P 500 last year, but also the 60%/40% stock/bond portfolio, we’re excited as we can possibly be at Valuentum.
2023 has been a great year thus far, and we continue to highlight the best areas for consideration following a great relative year in 2022. Highly-rated ideas on the Valuentum Buying Index are few and far between, but we’ll be going to “fully invested” soon enough. The regional banking crisis is having a muted impact on market sentiment at this point, and the Fed looks to be winning the battle against inflation. We’re excited about what the back of 2023 may look like, and we hope you are, too.
NOW READ: Why Are the Dividends of REITs So Risky?
<< FAQ: Where Can I Find the Valuentum Dividend Cushion Ratio?
<< Explaining the Difference Between the Adjusted and Unadjusted Dividend Cushion Ratio and More
———-

Tickerized for holdings in the REM and top holdings in AMLP.
Brian Nelson owns shares in SPY, SCHG, QQQ, DIA, VOT, BITO, RSP, and IWM. Valuentum owns SPY, SCHG, QQQ, VOO, and DIA. Brian Nelson’s household owns shares in HON, DIS, HAS, NKE, DIA, and RSP. Some of the securities written about in this article may be included in Valuentum’s simulated newsletter portfolios. Contact Valuentum for more information about its editorial policies.
Valuentum members have access to our 16-page stock reports, Valuentum Buying Index ratings, Dividend Cushion ratios, fair value estimates and ranges, dividend reports and more. Not a member? Subscribe today. The first 14 days are free.