
Image Shown: An overview of Newmont Corporation’s recent accomplishments. Image Source: Newmont Corporation – Third Quarter of 2020 IR Earnings Presentation
By Callum Turcan
Shares of Newmont Corporation (NEM) are included in the Dividend Growth Newsletter portfolio because we view its long-term dividend growth trajectory quite favorably, and the gold miner has not disappointed. At the start of 2020, Newmont significantly increased its quarterly dividend as we covered in this article here. Due to a combination of its enlarged dividend, very promising growth outlook, sizable expected synergies from its 2019 acquisition of Goldcorp, and its stellar cash flow profile, we added shares of NEM as a holding to our Dividend Growth Newsletter portfolio on January 13, 2020 (link here). As an aside, please note Newmont paid out a special dividend of $0.88 per share in 2019 as part of the Goldcorp deal.
Since then, synergies from the Goldcorp deal have been much stronger than expected (we covered that here), which has gone a long way in improving Newmont’s cost structure and outlook. An improving cost structure better positions Newmont to generate significant free cash flows in any precious metals pricing environment (specifically for gold, though Newmont procures other metals as well). For reference, Newmont is now targeting $500 million in annualized synergies versus $365 million initially.
With this is mind, we were very pleased to see Newmont recently grow its quarterly dividend from $0.25 per share to $0.40 per share, which was announced in late-October. Shares of NEM now yield ~2.6% on a forward-looking basis as of this writing when taking the latest payout increase into account. Newmont’s two meaningful dividend increases in 2020 highlights management’s high degree of confidence in the gold miner’s ability to continue outperforming going forward. On October 29, Newmont reported a stellar third quarter earnings report and shares of NEM moved higher by about 3% that day during normal trading hours.
Operations Update
The company is getting close to fixing the problems at its Musselwhite gold mine in Canada by rehabilitating a conveyor belt while bringing a new materials handling project online at the mine which will reduce operating expenses on a per unit basis going forward, which further improves its outlook. The materials handling project is currently being commissioned and the conveyor belt is expected to be commissioned by the end of this year. Please note that a fire at the mine in 2019 suspended underground mining operations, though since then rehabilitation efforts have enabled Newmont to slowly resume production activities. Here is what management had to say on the subject during Newmont’s latest earnings call (lightly edited, emphasis added):
“At Musselwhite, we successfully ramped up from care maintenance in the third quarter, and we started stockpile processing. And I’m delighted to say that we achieved mechanical completion of the conveyor system yesterday and have started the important process of wet commissioning. Over the coming weeks, the conveyors will be tested to ensure all components of the conveyor belts are safe and fully operational as expected. And I very much look forward to completing the full commissioning and reaching nameplate capacity of the belts in December…
Development rates at Musselwhite are exceeding plan and commissioning of the materials handling project has begun and is expected to be fully completed in November. We have also officially kicked-off our full potential program at Musselwhite building on the virtual efforts over the last several months. Overall, Musselwhite is very well-positioned to be fully up and running as we enter 2021 and we’ll be back stronger than ever before.” — Rob Atkinson, COO of Newmont
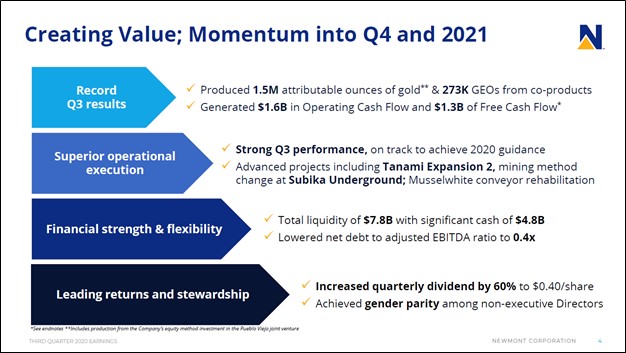
In the third quarter of 2020, Newmont produced over 1.5 million attributable ounces of gold with its gold costs applicable to sales (‘CAS’) coming in at $765 per ounce and its gold all-in sustaining costs (‘AISC’) coming in at $1,020 per ounce. The company maintained its long-term outlook regarding Newmont’s ability to produce north of 7 million attributable gold equivalent ounces (‘GEOs’) per year through the end of this decade. Bringing commercial-level production volumes back online from the Musselwhite gold mine will bolster Newmont’s output and reduce its operating expenses per unit going forward.
Additionally, please note Newmont also produced 273,000 GEOs last quarter according to management commentary, which is represented by copper, silver, lead, and zinc. Here is what management had to say regarding Newmont’s resource base during the firm’s latest earnings call (lightly edited, emphasis added):
“Underpinning our asset base are the largest gold reserves in the world with nearly 96 million ounces. We also offer substantial future upside to our dollar resources pipe with nearly 75 million ounces of measured and indicated resources. In addition to this, we have 63 million gold equivalent ounces in our reserves, which includes 15 billion pounds of copper. Importantly, 90% of our reserves are in the Americas and Australia… Our disciplined exploration program makes the groundwork for growing our reserves and resource base to sustain stable, steady production, and cash loans for decades to come.
…[O]ur portfolio will generate more than 6 million ounces of gold per year through 2029. This stable production profile is underpinned by our eight world-class assets, our industry-leading exploration program, and our latest three development projects: Tanami Expansion 2 which is in execution, and then Ahafo North and Yanacocha Sulfides both of which are in the late stages of the definitive feasibility… This profile is further enhanced by more than 1 million gold equivalent ounces from silver, lead and zinc at Penasquito and copper at Boddington and Yanacocha. Combined, we will deliver more than 7 million gold equivalent ounces per year for the next decade, the most of any company in our industry.” — Tom Palmer, President and CEO of Newmont
In the upcoming graphic down below, Newmont highlights its expected production base over the coming decade. Please note the gold equivalent ounces are represented by expected copper, silver, lead, and zinc as noted previously.

Image Shown: We appreciate the stable production outlook for Newmont, a product of its high-quality asset base. Image Source: Newmont – Third Quarter of 2020 IR Earnings Presentation
Financial Update
As a gold miner, Newmont has heavily benefited from the rally in gold prices seen this year. The firm’s GAAP revenues were up 17% year-over-year last quarter, hitting $3.2 billion. As it concerns Newmont’s GAAP operating income, please note the company recorded a $2.4 billion gain in the third quarter of 2019 when it formed its Nevada joint-venture with Barrick Gold Corporation (GOLD). Removing that one-time gain from the picture, Newmont’s GAAP operating income more than doubled year-over-year, hitting $0.9 billion last quarter.
At the end of September 2020, Newmont had $4.8 billion in cash and cash equivalents on hand. Please note Newmont also had $0.3 billion in short-term ‘investments’ and $3.0 billion in long-term ‘investments’ on hand at the end of this period. Some of those investments could be considered cash-like (though most of that is represented by strategic long-term assets), and furthermore, Newmont had $0.1 billion in restricted cash included in its ‘other non-current assets’ line-item (primarily for reclamation and remediation obligations).
Stacked up against $0.6 billion in short-term debt and $5.5 billion in long-term debt, Newmont’s net debt load is very manageable. Newmont had a net debt to adjusted EBITDA ratio of 0.4x at the end of its third quarter. During Newmont’s latest earnings call, management noted that S&P Global Inc (SPGI) “moved Newmont’s outlook from stable to positive and strong free cash flow prospects and reconfirmed our BBB credit rating.”
During the first nine months of 2020, Newmont generated $3.2 billion in net operating cash flow while spending $0.9 billion on capital expenditures. Management forecasts that Newmont will spend $1.4 billion on the miner’s capital expenditures this year. $2.3 billion in free cash flows during the first three quarters of 2020 fully covered $0.5 billion in dividend payments and $0.3 billion in share buybacks made during this period. We are very impressed with Newmont’s high-quality cash flow profile.
Concluding Thoughts
We continue to like shares of Newmont as a holding in the Dividend Growth Newsletter portfolio. On a final note, please be aware that when we update our models for the mining industry, there is a good chance the fair value estimate for NEM will increase. Newmont’s outlook is incredibly bright, and given the chance for additional fiscal stimulus measures in the US after the upcoming election and the chance for additional monetary stimulus measures around the world to help revive economic activities, the output for gold prices is skewed to the upside, in our view.
—–
Diversified Mining Industry – BHP FCX NEM RIO SCCO VALE WPM
Related: APAJF, BBL, GLD, SLV, GOLD, MITSY, ITOCY, PKX, GMBXF, FXI, MCHI, KWEB, JJCTF, RTPPF, COPX, DBB, CPER, JJC, TECK, HBM, AAUKF, AAUKY, GLCNF, GLNCY, FSUMF, ANFGF, SIL, USLV, PSLV, AGQ, SIVR, SILJ, SLVP, EWW, MXF, SPGI
—–
Valuentum members have access to our 16-page stock reports, Valuentum Buying Index ratings, Dividend Cushion ratios, fair value estimates and ranges, dividend reports and more. Not a member? Subscribe today. The first 14 days are free.
Callum Turcan does not own shares in any of the securities mentioned above. Newmont Corporation (NEM) is included in Valuentum’s simulated Dividend Growth Newsletter portfolio. Some of the other companies written about in this article may be included in Valuentum’s simulated newsletter portfolios. Contact Valuentum for more information about its editorial policies.