
Member LoginDividend CushionValue Trap
|
Newmont Surges Higher, Posts Solid Earnings Report
publication date: Aug 7, 2020
|
author/source: Callum Turcan
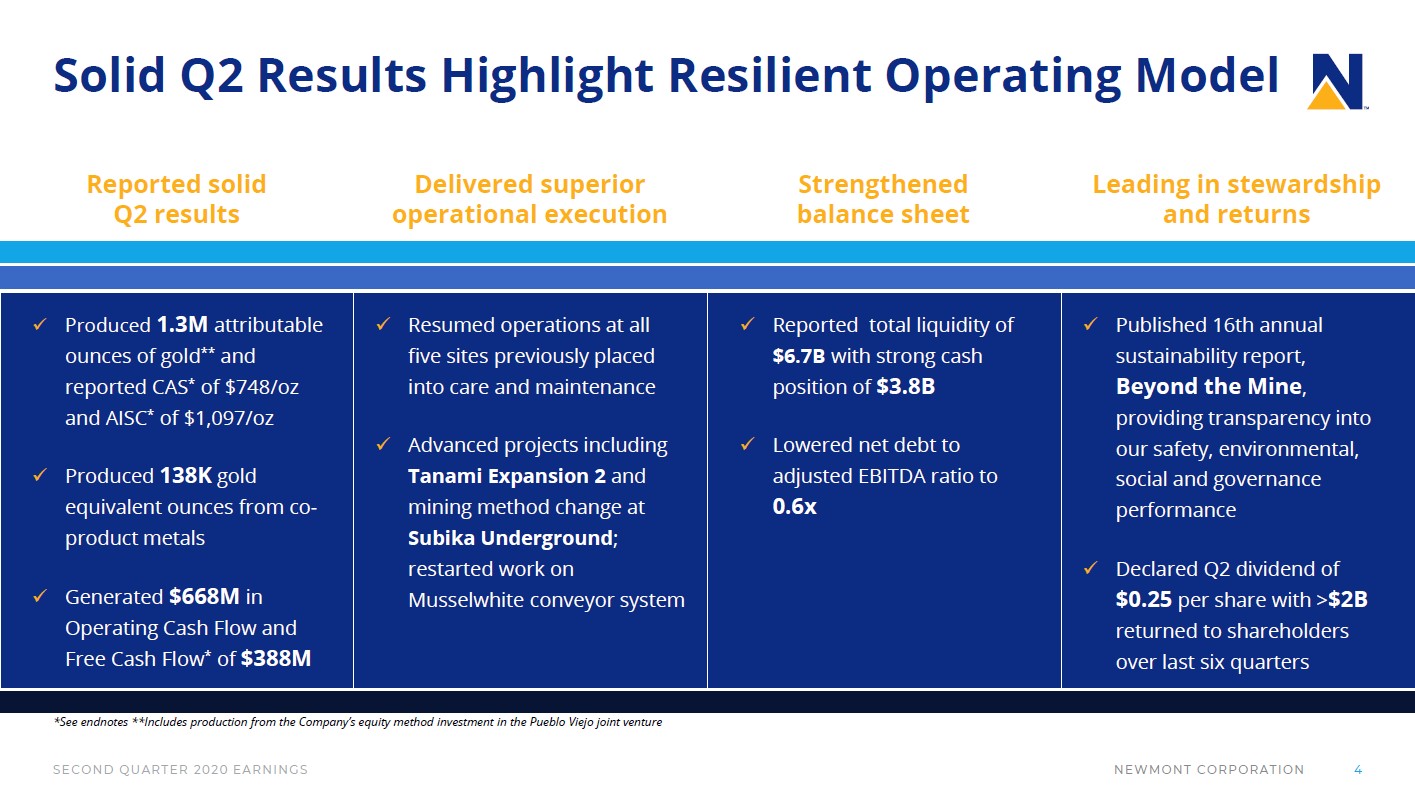
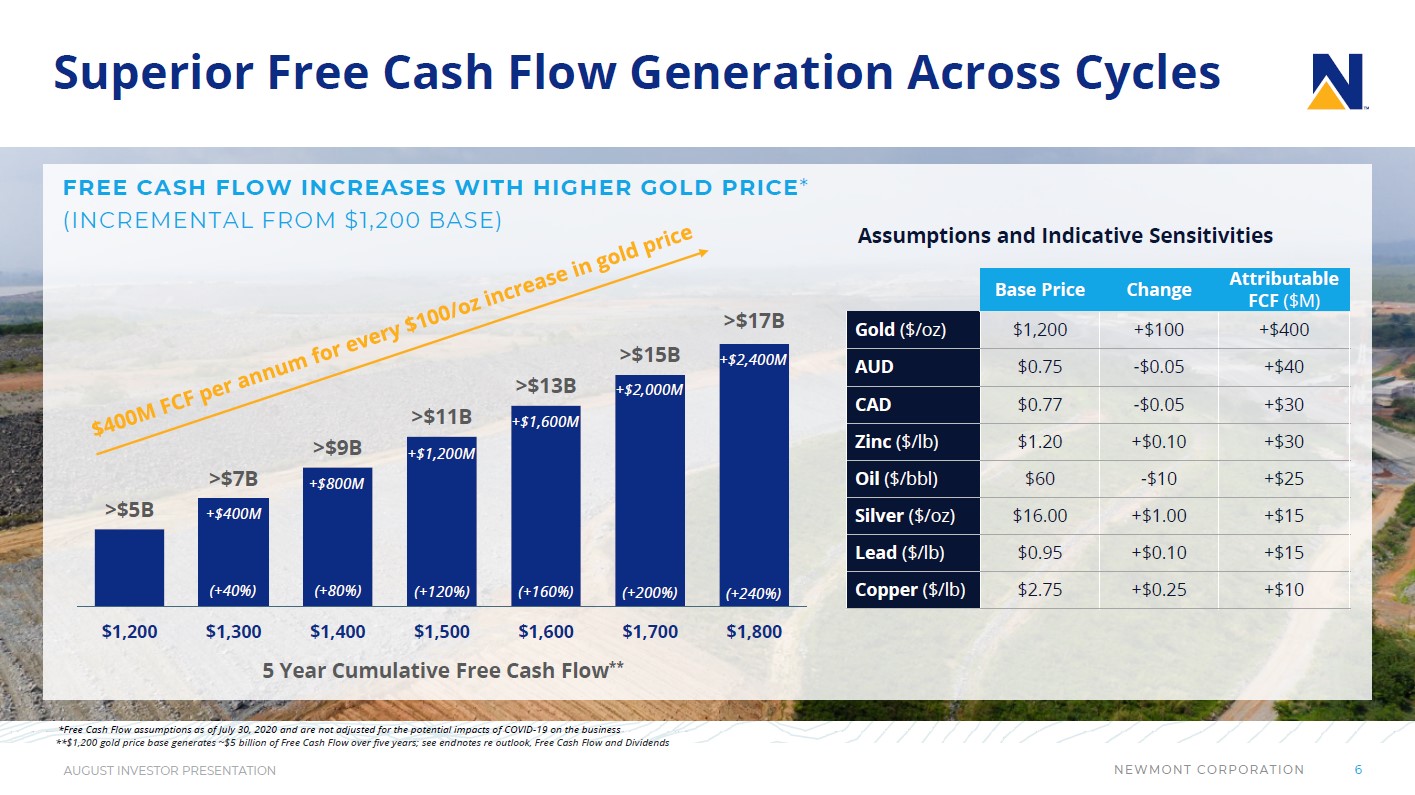
Image Shown: Newmont Corporation’s operational and financial performance has held up well in the face of the pandemic, relatively speaking. Image Source: Newmont Corporation – Second Quarter of 2020 IR Earnings Presentation By Callum Turcan Back on January 13, 2020, we added gold miner Newmont Corporation (NEM) to the Dividend Growth Newsletter portfolio at a modest weighting. Since then, shares of NEM are up ~64% as of this writing on August 6. Please note we significantly increased our fair value estimate for Newmont in July, and the firm’s updated 16-page Stock Report can be viewed here. Part of the reason for the positive revision came from Newmont expecting that it will generate greater synergies than first envisioned when it acquired Goldcorp in April 2019 ($500 million on an annualized basis by 2021, up from $365 million previously). Those cost savings helped Newmont stay quite profitable last quarter, when it reported $344 million in GAAP net income attributable to common shareholders. Furthermore, its revenue growth outlook has improved materially in the short- to medium-term due to gold prices hitting record highs recently. Newmont is very well-positioned to ride out the storm created by the ongoing coronavirus (‘COVID-19’) and we continue to like the firm as a holding in our Dividend Growth Newsletter portfolio. Shares of NEM yield ~1.4% as of this writing, and we give the company an “EXCELLENT” Dividend Safety rating as its Dividend Cushion ratio sits at 3.2 (link here for Newmont’s two-page Dividend Report). Please note that we forecast Newmont will steadily increase its per share payout over the coming years, which we factored in our Dividend Safety rating and Dividend Cushion ratio. Financial Update At the end of the second quarter of 2020, Newmont had $3.8 billion in cash and cash equivalents on hand versus $0.6 billion in short-term debt and $5.5 billion in long-term debt. From the end of 2019 to the end of June 2020, Newmont reduced its net debt load by ~$1.7 billion as it let cash build on the balance sheet which we appreciate. Newmont also had $0.3 billion in short-term investments and $3.0 billion in long-term investments on the books at the end of June 2020. That includes $0.3 billion in current marketable securities and $0.2 billion in non-current marketable securities, which could be viewed as cash-like (its $2.8 billion in equity method investments are not cash-like). Management has noted in the past, including during Newmont’s first quarter conference call, that the company would take advantage of elevated gold prices to pare down its net debt load. During Newmont’s second quarter conference call, management noted the firm “lowered our net debt to adjusted EBITDA ratio to 0.6 times” and we hope Newmont continues to reduce its net debt load over time. Newmont has ample liquidity to ride out the storm given its large cash position on hand. During the first half of 2020, Newmont generated $1.0 billion in free cash flow ($1.6 billion in net operating cash flow less $0.6 billion in capital expenditures). The gold miner spent $0.3 billion on both its common dividend obligations and share repurchases during this period, which was fully covered by its free cash flows. Over time, Newmont’s cash flow profile will continue to improve as it reduces its cost structure through the aforementioned synergies (includes cutting supply chain, G&A, and exploration expenses while boosting efficiency). Higher gold prices are expected to have a very powerful impact on Newmont’s forecasted future free cash flows, as you can see in the upcoming graphic down below.
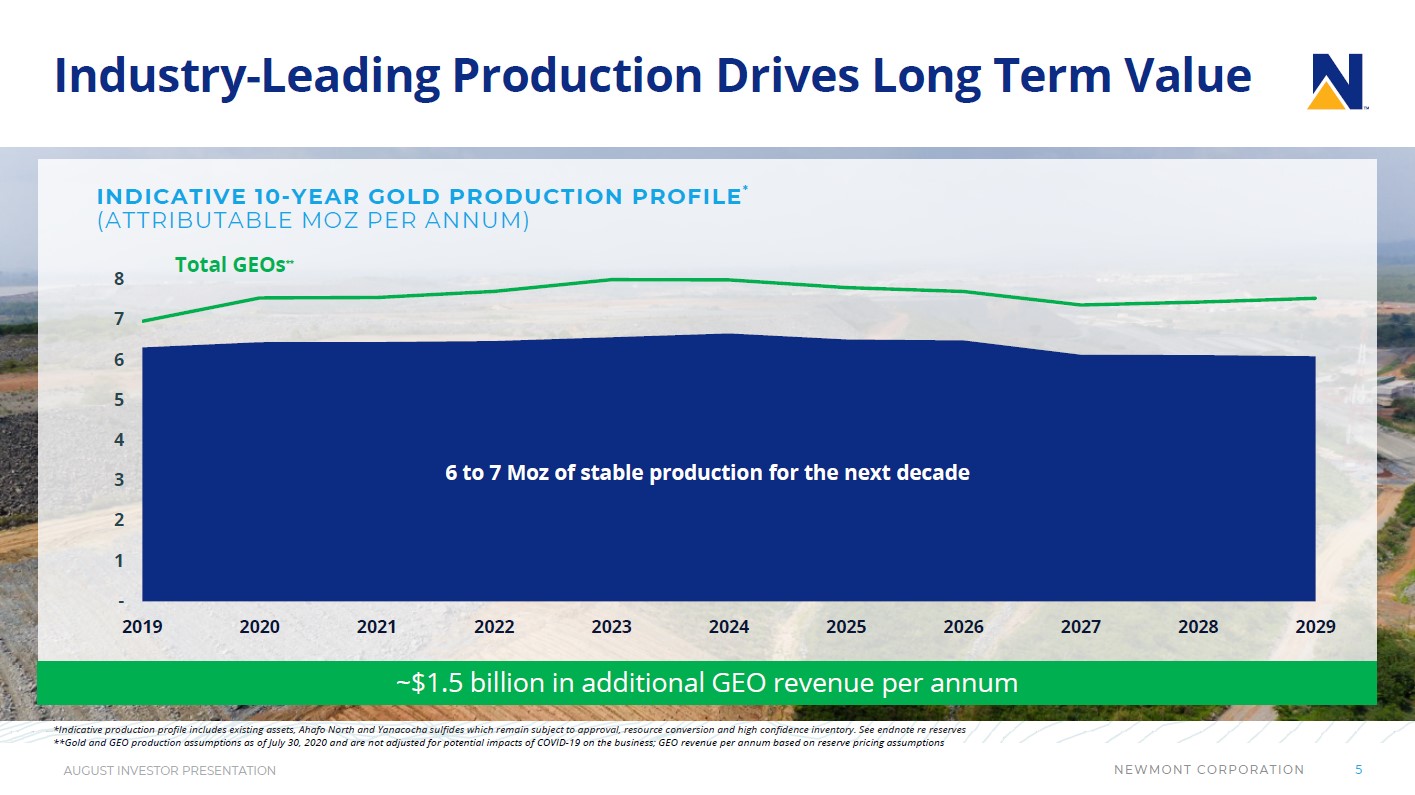
Image Shown: Gold prices have shot up above $2,000 per troy ounce as of this writing. Newmont uses the slide up above to highlight the powerful impact higher gold prices has on its expected future free cash flows. We are very optimistic on Newmont’s near- and medium-term trajectory given strong gold prices of late. Longer term, we are optimistic that improvements in its cost structure will support its free cash flow generating abilities in any pricing environment. Image Source: Newmont – August 2020 IR Presentation In the second quarter of 2020, Newmont reported 1.3 million ounces of attributable gold production and 0.1 million ounces of GEO production. Newmont’s GAAP revenues were up 5% year-over-year last quarter, and its GAAP operating income came in strong at $0.4 billion (up sharply from year-ago levels, though keep in mind year-over-year comparisons are noisy due the Goldcorp acquisition and COVID-19). We appreciate Newmont’s resilient financial performance during the initial phase of the pandemic. Operational Update Newmont is getting closer to restarting normal operations at its underground Musselwhite gold mine up in Canada, which was forced offline last year due to a fire that caused damage to key facilities. The company noted during its latest earnings call that conveyor installation work had resumed at the site as part of a safe start plan with local authorities and First Nation leaders. Management expects the conveyor installation project will be completed by the end of this year. Newmont mentioned that mining operations had “slightly resumed” at the Musselwhite site recently (the mine was previously in care and maintenance mode). The company is also getting close to completing a materials handling project at the Musselwhite mine which is expected to reduce operating costs on a per unit basis. Newmont noted that “the Musselwhite materials handling project will begin mobilizing for completion activities in September to align with the conveyor timeline” which means that shortly after completing the conveyor project, the company will finish the materials handling project (which is 95% complete). In short, the materials handling projects involves developing “an underground shaft [that] will hoist ore from the underground crushers, reducing haulage distances and ventilation costs.” By the fourth quarter of 2020, Newmont aims to begin really ramping mining activities back up at the Musselwhite mine. Beyond Musselwhite, Newmont turned four other mines back online (Cerro Negro, Yanacocha, Éléonore and Peñasquito) recently that were previously in care and maintenance mode. Those restarts really support the gold miner’s near-term outlook. Newmont expects it will report 6.0 million attributable ounces of gold production this year along with an additional 1.0 million ounces of gold equivalent ounce (‘GEO’) production (which includes zinc, lead, copper, and silver). Management expects the company will be able to produce 6.0-7.0 million ounces of attributable gold through 2029 (made possible through Newmont’s 95.7 million ounces of gold reserves), along with a significant amount of GEO production.
Image Shown: Given Newmont’s large reserve base, the company expects it can sustain its gold production profile through the end of this decade. Image Source: Newmont – August 2020 IR Presentation Newmont slightly reduced its “cost applicable to sales” per ounce (‘CAS’) forecast for 2020 during its latest earnings report. CAS covers “all direct and indirect costs related to current production incurred to execute the current mine plan” which some exclusions. Newmont’s “all-in sustaining cost” per ounce (‘AISC’) forecast for 2020 remained flat. We would like to stress here that the trajectory of the COVID-19 pandemic in the regions near Newmont’s gold mining operations will have a powerful impact on its near-term operational and financial performance. The company has already adjusted its 2020 guidance several times this year so far, largely due to the uncertainties created by the pandemic. Concluding Thoughts We continue to like shares of Newmont as a holding in the Dividend Growth Newsletter portfolio, and given the impressive strength seen with gold prices this year, the company’s outlook is quite bright. If Newmont continues to allow cash to build up on its balance sheet, its ability to push through meaningful per-share dividend increases would improve significantly. Newmont remains our favorite miner. ----- Diversified Mining Industry – BHP FCX NEM RIO SCCO VALE WPM Related: APAJF, BBL, GLD, SLV, GOLD, MITSY, ITOCY, PKX, GMBXF, FXI, MCHI, KWEB, JJCTF, RTPPF, COPX, DBB, CPER, JJC, TECK, HBM, AAUKF, AAUKY, GLCNF, GLNCY, FSUMF, ANFGF, SIL, USLV, PSLV, AGQ, SIVR, SILJ, SLVP, EWW, MXF ----- Valuentum members have access to our 16-page stock reports, Valuentum Buying Index ratings, Dividend Cushion ratios, fair value estimates and ranges, dividend reports and more. Not a member? Subscribe today. The first 14 days are free. Callum Turcan does not own shares in any of the securities mentioned above. Newmont Corporation (NEM) is included in Valuentum’s simulated Dividend Growth Newsletter portfolio. Both the simulated Best Ideas Newsletter and Dividend Growth Newsletter portfolios include a SPDR S&P 500 ETF Trust (SPY) put option holding with a $295 per share strike price that expire on August 21, 2020. Some of the other companies written about in this article may be included in Valuentum's simulated newsletter portfolios. Contact Valuentum for more information about its editorial policies. |


0 Comments Posted Leave a comment