
Member LoginDividend CushionValue Trap
|
Update: Analyzing Valuentum’s Economic Castle Index: A Walk Forward Case Study
publication date: Feb 25, 2022
|
author/source: Callum Turcan and Brian Nelson, CFA
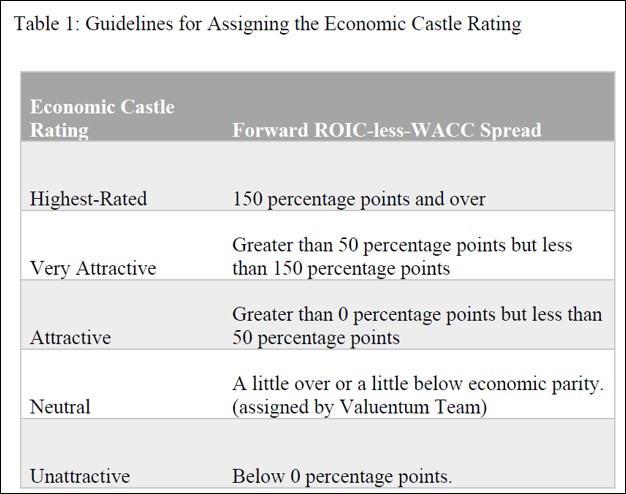
This article was originally published February 20, 2020. By Callum Turcan and Brian Nelson, CFA In May 2015, the Valuentum team published a paper called The Castle Trumps the Moat which sought to change the conversation around Warren Buffett’s very popular phrase “economic moat” towards one with a more quantitative grounding. The idea behind an economic moat is that companies with such a qualitative attribute should generate stronger returns than those that don’t, at least so the thinking goes, given the ability for these firms to generate competitive advantages for themselves in their respective fields (allowing for these firms to charge relatively higher prices and/or incur lower expenses, resulting in larger profit streams than “non-moaty” companies). There are two things generally wrong with a pure economic moat assessment, or economic “moat factor.” First, it is much easier to assess outsize economic returns in the near-term than it is to assess outsize economic returns over the long haul. Quite simply, nobody can predict what will happen tomorrow, and they certainly don’t know what will happen 20 or 30 years from now. Second, a rational investor should generally prefer expected near-term outsize economic returns than expected long-term ones given the uncertainty of the latter--somewhat related to our first point, a bird in the hand (or large economic returns in the near term) is worth two in the bush (or large economic returns in the long run that may not materialize). The time value of money reinforces this notion. Near-term economic returns are generally worth more than long-term ones in real terms, even if they may be smaller nominally. This is where our Economic Castle rating comes in. The goal of the Economic Castle rating is to identify those companies that are likely to generate a lot (or not so much) shareholder value over the foreseeable future. Instead of pondering a guess as to how the landscape will look 20 or 30 years from now, something not even the Oracle of Omaha can do with any sort of certainty (e.g. IBM, KHC), the Economic Castle rating ranks companies based on near-term expected economic returns, or returns that are more likely to be realized as opposed to those that may be built on “castles in the air” over 20-30 time horizons. By evaluating companies on the basis of the spread between their forecasted future return on invested capital (‘ROIC’) excluding goodwill less their estimated weighted-average cost of capital (‘WACC’), we measure a company’s ability to generate an “economic profit” over the foreseeable future, which we define as the next five fiscal years. Companies that generate a forecasted spread of 50 percentage points or more are given a “Very Attractive” Economic Castle rating and firms that are forecasted to generate a spread of 150 percentage points or higher are considered “Highest-Rated”. Firms that carry an Unattractive Economic Castle rating are those that are forecasted to generate a forward ROIC (ex-goodwill) less estimated WACC spread that’s meaningfully below zero (firms near economic parity can receive a Neutral Economic Castle rating, assigned by the Valuentum team). The upcoming graphic down below highlights our guidelines for assigning Economic Castle ratings.
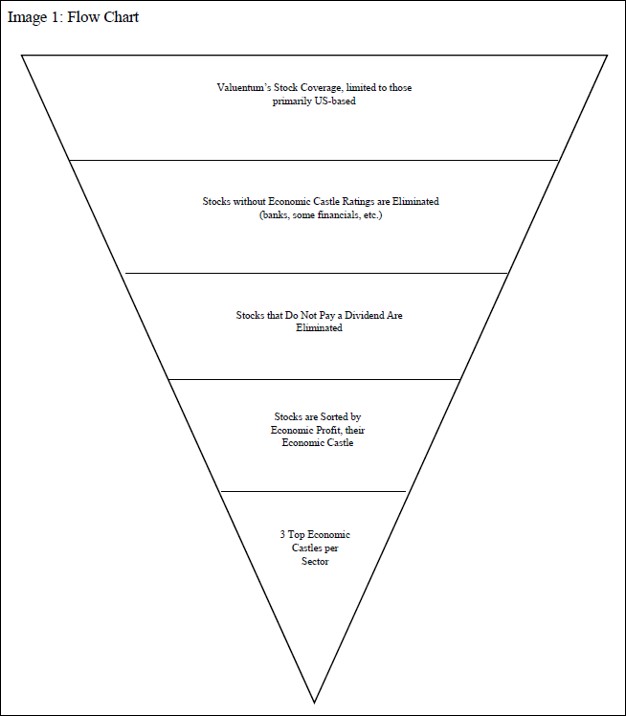
Image Shown: An overview of Valuentum’s proprietary Economic Castle rating system. Back as part of the May 2015 paper, the Valuentum team used its coverage universe and a set of rules to locate the top three companies by Economic Castle rating in each sector to create the Valuentum Economic Castle Index. Down in the upcoming graphic below is a look at the security selection methodology used during this index building process.
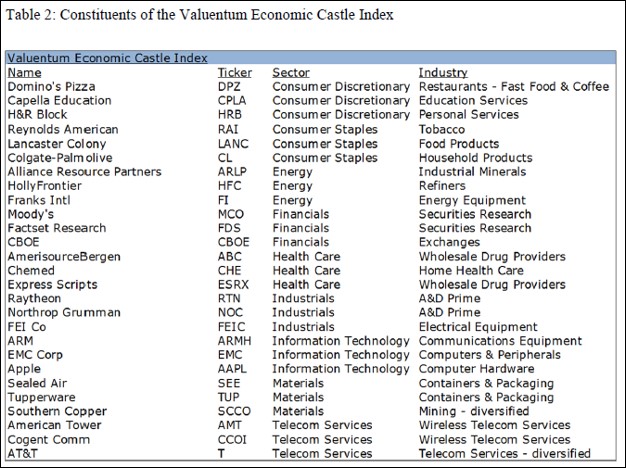
Image Shown: An overview of how the Valuentum team constructed the Valuentum Economic Castle Index. The upcoming graphic down below highlights the resulting composition of the Valuentum Economic Castle Index, which consisted of 27 companies across nine different sectors, after conducting our aforementioned index building process.
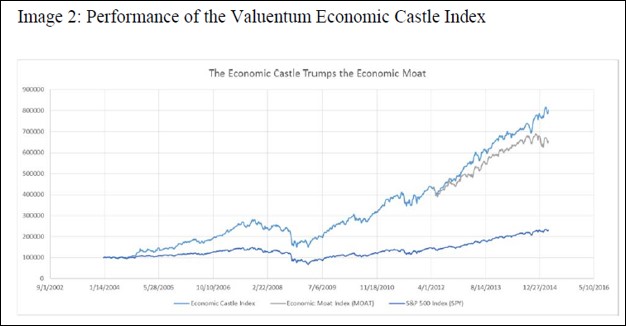
Image Shown: The Valuentum Economic Castle Index, the subject of our May 2015 paper and our walk forward test we are covering in this article and others. As part of the May 2015 paper, the Valuentum team measured the performance of the Valuentum Economic Castle Index against the S&P 500 (SPY) and the VanEck Vectors Morningstar Wide Moat ETF (MOAT). Please note Morningstar Inc (MORN) created the Wide Moat Focus Index “to track the overall performance of attractively priced companies with sustainable competitive advantages according to Morningstar's equity research team.” In the backtest, what Valuentum’s team discovered was that the Valuentum Economic Castle Index outperformed both the S&P 500 and MOAT ETF during the observed period (from 2004 to early-May 2015), as you can see in the graphic below.
Image Shown: Valuentum’s Economic Castle Index trumps the S&P 500 and the MOAT ETF. Walk Forward Test Backtests are the start of research, however, not the conclusion. In order to gauge whether this trend continued going forward, we measured the performance of the Economic Castle Index portfolio from the market close on May 1, 2015 to the market close on January 14, 2020, but first we had to make a couple adjustments given that a number of “economic castles” were bought out or merged during the study period. During the observed period, the Economic Castle Index portfolio (excluding CPLA, RAI, ESRX, FEIC ARMH, and EMC) returned 60.51% when excluding dividend considerations, and that goes up to 73.57% when including dividends received or entitled to. When including the grossed up* total return of the six aforementioned companies, the portfolio’s return when including dividends received or entitled to grew to 79.25% during the observed period. During the observed period for this walk-forward test, the S&P 500 returned 55.73% before including dividends and 66.80% after including dividends received or entitled to. The Valuentum Economic Castle Index did better than the S&P 500 during the observed period, with or without including the six aforementioned companies. That implies that investors have generally preferred companies garnering lofty economic castles versus a broad basket of equities, like the S&P 500. We used the SPDR S&P 500 ETF Trust (SPY) to gauge the dividends received or entitled to as part of the total S&P 500 return calculation. Pivoting now to the VanEck Vectors Morningstar Wide Moat ETF (MOAT), the Morningstar Wide Moat ETF also outperformed the S&P 500. During the observed period, the MOAT ETF returned 75.42% before including dividend considerations and 84.67% after including dividends received or entitled to. Here we would like to note that Morningstar actively removes companies from the Wide Moat ETF and replaces them with new ones, making a comparison between Valuentum’s Economic Castle Index not quite apples-to-apples in this study. For example, because the Economic Castle Index is not a live index, no alterations were made from the original paper. Entities such as master limited partnership Alliance Resource Partners (ARLP), multi-level-marketing company Tupperware (TUP), and Franks Intl (FI), all of which were huge drags on the Economic Castle Index return would have almost certainly been removed prior to the worst of their declines due to their deteriorating outlooks. Neither one, for example, currently holds a Very Attractive or Highest Rated rating, unlike some of the biggest winners in the Economic Castle Index, including Domino’s (DPZ) and Apple (AAPL), which still retain the strongest ratings. We therefore feel it appropriate to make another adjustment to simulate a “what if” scenario, had the Economic Castle Index been actively managed like the MOAT ETF. Excluding the impact on the returns from ARLP, TUP, and FI (and excluding the returns of the six aforementioned companies), the Valuentum Economic Castle Index would have returned 83.69% when excluding dividend considerations and 96.09% including dividends received. When grossing up* the total return of the six aforementioned companies and not including ARLP, TUP, and FI, the portfolio’s return would have been even greater. There is strong backtest and walk-forward support for an actively-managed Economic Castle Index ETF, in our view. Concluding Thoughts
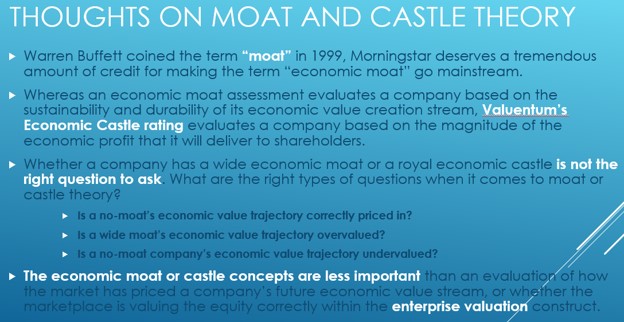
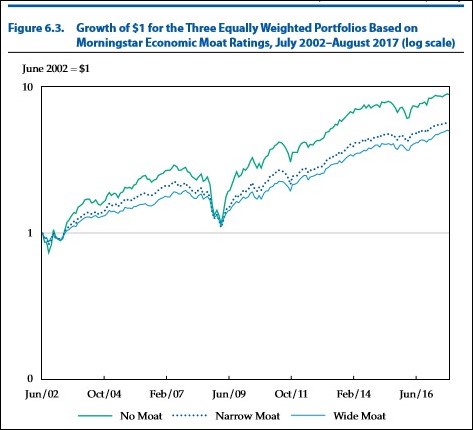
Image Source: Valuentum’s Persentation of Value Trap Both economic castle analysis and economic moat analysis are very strong components of due diligence, and our evaluation in this study shows that both can be extremely valuable to generating outperforming returns. That said, there are some important points worth clarifying. Per studies performed by Morningstar and published in CFA institute papers, wide economic moats generally underperform narrow economic moats and no economic moats. Generally, wide moats underperform the rest of the market, see CFA study here. We therefore attribute the outperformance of the MOAT ETF relative to the S&P 500 in the study more to Morningstar’s ability to identify undervalued companies that appreciated toward intrinsic value, rather than the companies themselves having “moaty” characteristics alone. To reiterate, the performance of the MOAT ETF offers strong support for the economic moat concept used in enterprise valuation, or the free cash flow to the firm process, the basis for the Theory of Universal Valuation, as outlined in Value Trap. A moat assessment is used to better calculate an intrinsic value estimate (see support for "Porter's Gospel" here), and with almost all factors, moats are not causal to the investment outcome by themselves, per se. For example, a wide moat company can be purchased at nose-bleed levels and underperform miserably, while a no moat company can be bought at a bargain price and outperform significantly (more on this here). Whereas the MOAT ETF is a multi-factor approach embracing enterprise valuation, the Economic Castle Index includes companies solely on the basis of their economic-return characteristics (regardless of their valuation considerations), and such an index offers a purer perspective of the economic-castle “factor” than the MOAT ETF does with the moat “factor”. Said another way, all else equal, castles should generally be preferred over moats, given the evidence of the outperformance of castles in this study and the underperformance of wide moats to the market in the Morningstar/CFA study, per below.
Image Source: CFA Institute Research Foundation
All of this remains consistent with the Theory of Universal Valuation. Generally speaking, a basket of no moats and narrow moats should generate better returns than wide moats over “long-enough” periods of time because of their higher risk profiles (and their respective cost of equities, the pace at which value advances by). No moat and narrow moat companies tend to have higher-duration value (cash flow) compositions, too (i.e. most of the value is out long into the future), a consideration that has been augmented more than the lower-duration value composition of wide-moat entities as a result of falling interest rates (during the past decade or so), boosting relative performance. It might also be reasoned that rational investors should generally prefer “more predictable” near-term outsize economic return profiles (that could surprise to the upside in duration) than more uncertain long-duration ones (that could surprise to the downside via truncation). However, what happened in this particular study period is a bit more complicated than just investor preference. Those companies with expected near-term outsize economic return profiles (strong Economic Castle ratings) exceeded market expectations over the period of the study to drive their returns above that of the market. Also, those companies with expected long-term outsize economic return profiles and were undervalued (wide moats + undervalued), as measured by the MOAT ETF, seem to have exceeded market expectations over the period of the study to drive their returns above that of the market, too. Though castles may be better than moats, by themselves, and enterprise valuation may be paramount to any process in augmenting returns, as in the MOAT ETF, prices and returns will always be driven by changes in future expectations, or expectations revisions, not the absolute assessment of a company’s moat or castle, itself. The economic moat or castle concepts are less important than an evaluation of how the market has priced a company’s future economic value stream, or whether the marketplace is valuing the equity correctly within the enterprise valuation construct. Hence, the strong outperformance of the Best Ideas Newsletter portfolio and the MOAT ETF, both of which have an enterprise valuation overlay. We continue to study the behavior (magnitude and duration) of future expected economic profits and its impact on stock prices and returns, and we maintain our view that an Economic Castle Index ETF may make for a great consideration for investors looking to capitalize on this research. Contact Valuentum at info@valuentum.com to license our Economic Castle Index. ---------- * To gross up the returns for the six companies that were bought out or merged during the observed period (i.e. there were 1,719 days between May 1, 2015 and January 14, 2020, and if Company X was bought out after 1,000 days during the observed period, the grossed up total return, defined as Y, would be Y multiplied by [1,719 days divided by 1,000 days] to get the total grossed up return). This was done to better reflect the performance of the index during the observed period. Valuentum members have access to our 16-page stock reports, Valuentum Buying Index ratings, Dividend Cushion ratios, fair value estimates and ranges, dividend reports and more. Not a member? Subscribe today. The first 14 days are free. |


1 Comments Posted Leave a comment