

Image Shown: Alibaba Group Holding Limited posted strong results for the fiscal quarter ended June 30, 2020, mirroring the performance of its large-cap tech peers based in Western countries (particularly the US). Image Source: Alibaba Group Holding Limited – June Quarter 2020 Earnings Presentation
By Callum Turcan
At a time when US-China geopolitical tensions are rising and the Trump Administration is pushing the Chinese tech firm ByteDance to divest (at least) the US-based operations of TikTok, many Chinese tech firms are still thriving. The ongoing coronavirus (‘COVID-19’) pandemic has fundamentally altered daily life for most households around the world. Social distancing practices have aggressively driven up e-commerce demand along with demand for cloud computing offerings (as more employees work from home and as households stay indoors for significantly longer periods).
Alibaba
On August 20, Alibaba Group Holding Limited (BABA) posted earnings for the first quarter of fiscal 2021 (period ended June 30, 2020). The company beat consensus estimates on both the top- and bottom-lines with its GAAP revenue and GAAP income from operations up 34% and 42% year-over-year, respectively, in Renminbi (‘RMB’) terms. Its cloud computing revenue was up 59% year-over-year last fiscal quarter. This complemented the strong performance of Alibaba’s e-commerce operations in China as the gross merchandise volume (‘GMV’) for physical goods (excluding unpaid orders) at its Tmall (business-to-consumer) marketplace rose 27% year-over-year. Alibaba’s Lazada e-commerce marketplace (which Alibaba owns the vast majority of) that focuses on markets in Southeast Asia also posted strong results last fiscal quarter. Here is what management had to say during Alibaba’s latest earnings call (emphasis added):
“Digital adoption and transformation is a prevailing trend in this changed landscape, and we are confident that we can create Alibaba’s future by capitalizing on the opportunities in this challenging environment. Just as we did in 2003 during SARS and in 2008 during the global financial crisis. In the 12 months ended June 2020, annual active consumers on our China retail marketplaces reached 742 million, representing a quarterly net increase of 16 million. Mobile MAUs on our China retail marketplaces reached 874 million, an increase of 28 million since March. These numbers reflect Taobao’s [consumer-to-consumer e-commerce marketplace] continuing strong consumer mind share, healthy user stickiness and engaging user experiences as the world’s leading consumer community.
Tmall online physical goods GMV, excluding unpaid orders, grew 27% year-over-year with all major categories growing at a similar or faster rate relative to December 2019 quarter. Our unparalleled product offerings and engaging user experiences contributed to higher purchase frequency as well as higher average spending per customer across all city tiers that increased both year-over-year and quarter-over-quarter.
In terms of user acquisition, we continued to increase our penetration in less-developed markets. Taobao Deals, our new mobile app targeting value-conscious consumers, reached 40 million MAU in June. The disruption in international tourism presented an opportunity for our import commerce business. Tmall Global, the leading cross-border import platform in China, grew over 40% year-over-year in GMV, excluding unpaid orders.” — Daniel Zhang, CEO of Alibaba
Alibaba’s various e-commerce marketplaces performed quite well last fiscal quarter, though we caution that the company’s trajectory will be determined in large part by the trajectory of China’s economy. Should China ease up on stimulus efforts (launched to offset the headwinds created by COVID-19) to rein in debt loads at various government entities, that could pose a serious problem for Alibaba if Chinese consumers scale back their spending levels.
Financial Update
In US dollar terms, Alibaba had $43.8 billion in cash and cash equivalents, $10.2 billion in short-term investments, and $0.7 billion in current equity securities and other investments on hand as of June 30, 2020 (along with $52.9 billion in non-current ‘equity securities and other investments’ and ‘investment in equity method investees’ combined). As of June 30, Alibaba had $0.6 billion in short-term debt and $17.1 billion in long-term debt.
We appreciate Alibaba’s pristine balance sheet, though its far-flung investments can make its financial statements a messy read. In the upcoming graphic down below, Alibaba highlights that it generated $5.2 billion in free cash flow (by the company’s definition) in US dollar terms last fiscal quarter. Please note that the currency conversion rates used by Alibaba were based on exchange rates as of June 30, 2020.
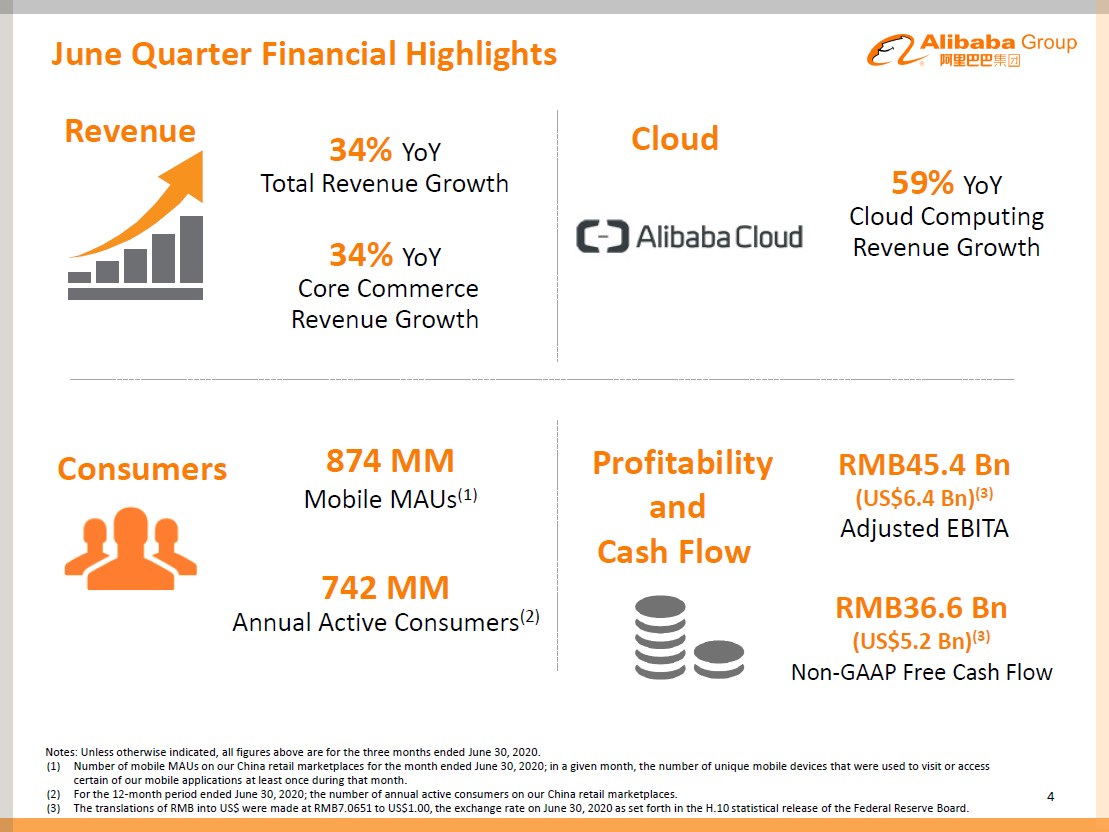
Image Shown: Alibaba posted impressive growth at its cloud computing and e-commerce divisions last fiscal quarter, which helped the firm generate meaningful free cash flows. Image Source: Alibaba – June Quarter 2020 Earnings Presentation
Upcoming IPO
Alibaba’s spin-off Ant Group (which offers a wide slate of financial services to its customers and helped drive China’s transition towards mobile payments) recently filed to go public, with shares set to be listed on stock exchanges in Hong Kong and Shanghai. Initially, the predecessor to Ant Group (the firm has rebranded at least a couple times) was created to handle payments on Alibaba’s e-commerce marketplaces (a mobile-oriented payment processing service known as Alipay).
Later on, the firm that would become Ant Group started offering other financial products to its customers, such as insurance and wealth management services. Two years ago, Ant Group was valued at ~$150 billion, so this represents a big initial public offering (‘IPO’). According to the WSJ (citing data from Ant Group’s filing), Alibaba owns approximately a third of Ant Group and Jack Ma, co-founder of Alibaba, controls approximately 50.5% of Ant Group’s voting rights. We will be keeping a close eye on the IPO.
Concluding Thoughts
The performance of Alibaba last fiscal quarter largely mirrors that of its large-cap tech peers based in Western countries, particularly the US. We continue to like large-cap tech companies with pristine balance sheets and high quality cash flow profiles as the best way to ride out the pandemic, though we are not interested in adding shares of BABA to our newsletter portfolios at this time given ongoing US-China geopolitical tensions.
—–
Banks & Money Centers Industry – AXP BAC BBT BK C DFS FITB GS HSBC JPM KEY MS NTRS PNC RF STI TCF USB WFC
Internet Content & Services Industry – GOOG GOOGL BIDU FB JD TCEHY TWTR
Internet Content and Catalog Retail Industry – BABA AMZN BKNG EBAY EXPE GRPN IAC OSTK QRTEA STMP
Financial Tech Services Industry – MA MELI PYPL VRSK V
Software Industry – ADBE ADSK EBIX INTU MSFT ORCL CRM
Related: IYG, IPAY, IYF, XLF, FXI, MCHI
Other: TCEHY, JD, NTES, BIDU, TAL, SINA, JOBS, TCOM, SOHU, SOGO, CYOU
—–
Valuentum members have access to our 16-page stock reports, Valuentum Buying Index ratings, Dividend Cushion ratios, fair value estimates and ranges, dividend reports and more. Not a member? Subscribe today. The first 14 days are free.
Callum Turcan does not own shares in any of the securities mentioned above. Apple Inc (AAPL), Alphabet Inc (GOOG) Class C shares, Facebook Inc (FB), Microsoft Corporation (MSFT), PayPal Holdings Inc (PYPL), and Visa Inc (V) are all included in Valuentum’s simulated Best Ideas Newsletter portfolio. Apple Inc, Microsoft Corporation, and Oracle Corporation (ORCL) are all included in Valuentum’s simulated Dividend Growth Newsletter portfolio. Some of the other companies written about in this article may be included in Valuentum’s simulated newsletter portfolios. Contact Valuentum for more information about its editorial policies.