
Note: A more recent analysis of the Valuentum Buying Index rating system can be accessed at the following link: /Value_and_Momentum_Within_Stocks_Too
A version of this article was published October 26, 2013.
By Brian Nelson, CFA
We periodically update the performance results of the Valuentum Buying Index (VBI), the stock-selection methodology that drives idea-generation within the Best Ideas portfolio. The academic studies of the Valuentum Buying Index can be accessed here (white paper) and here (AAII).
The latest iteration of the performance, dated September 3, 2014, continues to showcase the strong sorting mechanism embedded within the investing framework, particularly when the index is coupled with qualitative oversight and portfolio management skill. Sorting winners from losers is what the Valuentum Buying Index has been designed to do, and its application as both an avenue for idea generation and as an overlay to assign weightings within the portfolio-management setting has become ever-more apparent with continued usage.
Measurement Process
That said, we continue to learn more about the efficacy of the Valuentum Buying Index, both for idea generation and within the portfolio management process. Though many investors use the index in different ways, we believe that we know best about how to use, apply, and measure the methodology. We plan to continue to make improvements and enhancements to the system such that it is optimized for investors of all types. We’ve already taken strides in this respect within the dividend growth framework.
The Valuentum Buying Index primarily is applied as a screening system that highlights new ideas for consideration. Empirical results have shown that high-rated equities tend to outperform low-rated equities over varying time periods. We’ve seen this dynamic play out time and time again, not only within the Best Ideas portfolio, but also within certain measurement criteria among a random basket of stocks, independent of Valuentum influence.
In the Best Ideas portfolio, the Valuentum team provides a qualitative overlay to the system, adding specific firms to the portfolio, when deemed appropriate (on the basis of primarily the Valuentum Buying Index but with qualitative judgment). This dynamic introduces a subjective influence on the system that we think is value-add, and one in which we believe should also be included as part of the performance of the Valuentum Buying Index.
For example, just like a value manager doesn’t add every undervalued stock on the market to his or her portfolio (and is therefore not measured on the stocks he or she doesn’t include in the portfolios), we don’t add every high-Valuentum Buying Index-rated stock to the portfolios of the Best Ideas Newsletter and/or Dividend Growth Newsletter (and by extension and similarly, we don’t think it makes sense to measure performance on stocks that aren’t included either).
As such, we measure the efficacy of the Valuentum Buying Index within the Best Ideas portfolio itself, instead of randomly across a data set. Preliminary evidence, however, suggests that the Valuentum Buying Index is efficacious under both scenarios: with the Valuentum team’s judgment (i.e. within the Best Ideas portfolio) and without the Valuentum team’s judgment (i.e. across a randomly provided data set). We hope to gain approval to publish more data along the lines of the latter in coming months.
The Results
We use the Best Ideas portfolio in the initial edition of the Best Ideas Newsletter as the starting point. We plan to introduce a rolling performance measure incorporating each subsequent edition of the portfolio in later measurement exercises. However, at this point, we use the earliest data point we have to provide the greatest length of time such that members can get a less-noisy view of the performance (a longer-term view). Performance measurement is ongoing.
To replicate this study, members can look at and combine it with the exit points of relevant positions in the transaction log (and use current stock prices for holdings still included in the portfolio, as of the date of this article) to come up with the percentages outlined below. We understand that members may want to dissect the Valuentum Buying Index in a variety of other ways, and we encourage such analysis. However, we continue to point investors to the application of the Valuentum Buying Index within the Best Ideas portfolio for the best-known efficacy at this time.
We strive to be completely transparent, and we want you to see what we are doing because we think the more you know about the Valuentum Buying Index, the more you’ll like it. The sample set used in this analysis resided (resides) in the actively-managed Best Ideas portfolio–constituents influenced in part by the Valuentum team–but we credit the Valuentum Buying Index, the methodology, for largely being responsible for sorting stronger-performing stocks from poorly-performing ones.
The Best Ideas portfolio generally holds about 10-20 stocks, and the equities used in this analysis were pulled from a sample of all the stocks on the market (limited to the ones we cover). In this light, the combination of the Valuentum Buying Index and the team’s subjective portfolio management overlay is extremely valuable and empirically a powerful stock-selection system. No methodology is perfect by any stretch of the imagination, but we think the Valuentum Buying Index is one of the best.
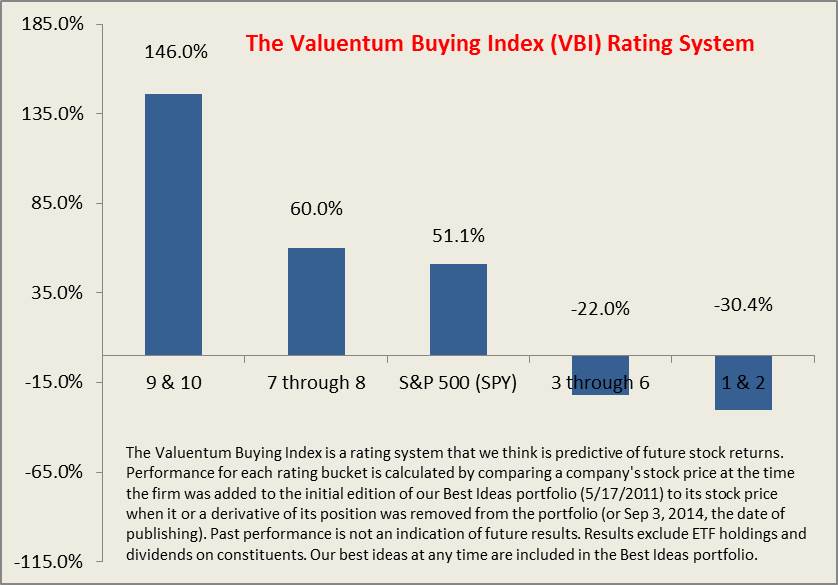
The bar chart below shows that there is a strong positive correlation between high Valuentum Buying Index ratings (9 and 10) and better relative investment return performance (specifically over the time period measured through today). The current Best Ideas portfolio can be accessed here.
<< Read expanded test case study here
Firms included in study: AAPL, ACOM, ATRO, EDAC, MO, BWLD, PSS, PCP, RSG, AMR, SPY (view coverage universe here). The academic studies of the Valuentum Buying Index can be accessed here (white paper) and here (AAII).
Past results are not a guarantee of future performance. The Best Ideas Newsletter portfolio and Dividend Growth Newsletter portfolio are not real money portfolios. Results are hypothetical and do not represent actual trading. Valuentum is an investment research publishing company.