Member LoginDividend CushionValue Trap
|
Stock-Selection Methodology, the Valuentum Buying Index
publication date: Jul 10, 2017
|
author/source: Valuentum Analysts
Methodology for Selecting Stocks -- the Valuentum Buying Index At Valuentum, we think some of the best opportunities arise from an understanding of a variety of investing disciplines in order to identify the most attractive stocks at any given time. Valuentum therefore analyzes each stock across a wide spectrum of philosophies, from deep value through momentum investing. We think companies that are attractive from a number of investment perspectives--whether it be growth, value, income, momentum, etc.--have the greatest probability of capital appreciation and relative outperformance. The more deep-pocketed institutional investors that are interested in the stock for reasons based on their respective investment mandates, we posit the more likely it will be bought and the more likely the price will move higher to converge to its "true" intrinsic value (buying a stock pushes its price higher). On the other hand, we think the worst stocks will be shunned by most investment disciplines and display expensive valuations, poor technicals and deteriorating momentum indicators. Click to Sign Up! First 14-days FREE! We think stocks that meet our demanding criteria fall in the center of the Venn diagram below, displaying attractive characteristics from a discounted cash-flow basis, a relative value basis, and with respect to a technical and momentum assessment. The size of the circles generally reveals the relative emphasis we place on each investment consideration, while the arrows display the order of our process -- value first then technicals and momentum last. We may like firms that are undervalued both on a discounted cash flow (DCF) basis and relative value basis, but we won't like firms just because they're currently exhibiting attractive technical or momentum indicators. We're not traders or speculators. We target the long term, and we want to have a strong process to support the ideas we deliver to our subscribers.
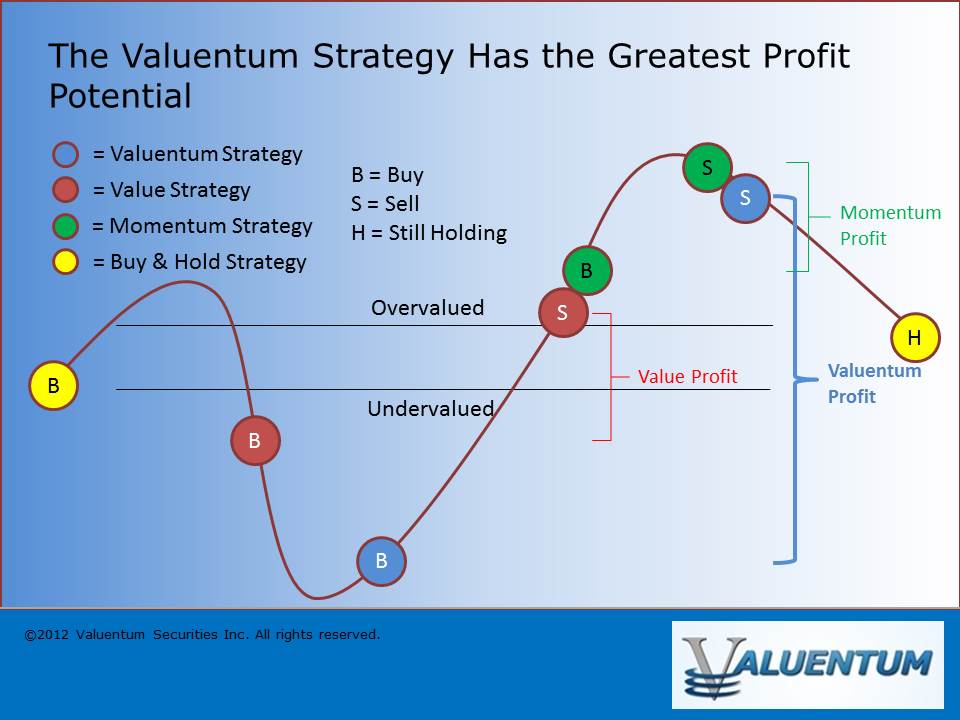
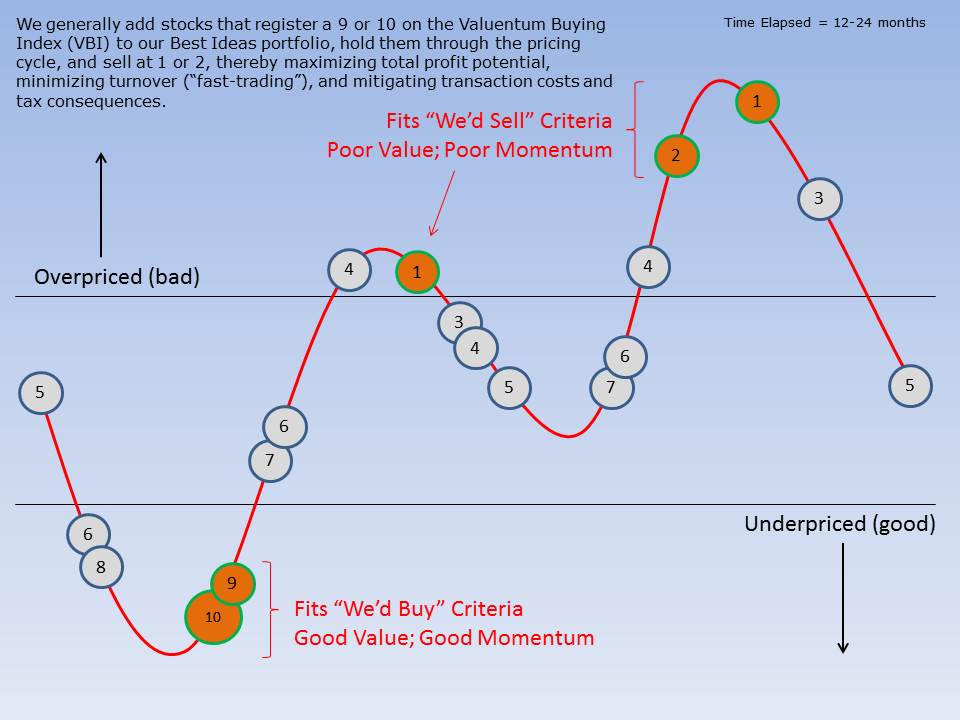
We think research firms that just focus on valuation may expose readers to a stock on its way down (a falling knife), while those that just use technical and momentum indicators may expose portfolios to significantly overpriced stocks at their peaks. It is our view that only when both sides of the investment spectrum are combined can investors find undervalued stocks at potentially timely prices for consideration. Let's examine the chart below, which showcases how the Valuentum process, by definition, may have the greatest profit potential of any common investing strategy. The Valuentum process targets adding stocks to actively-managed portfolios when both value and momentum characteristics are "good" and removing them when both value and momentum characteristics are "bad" (blue circles: Buy --> Sell). We define the Valuentum strategy as capturing the entire equity pricing cycle, while the value and momentum strategies individually truncate profits, as illustrated in the image below.
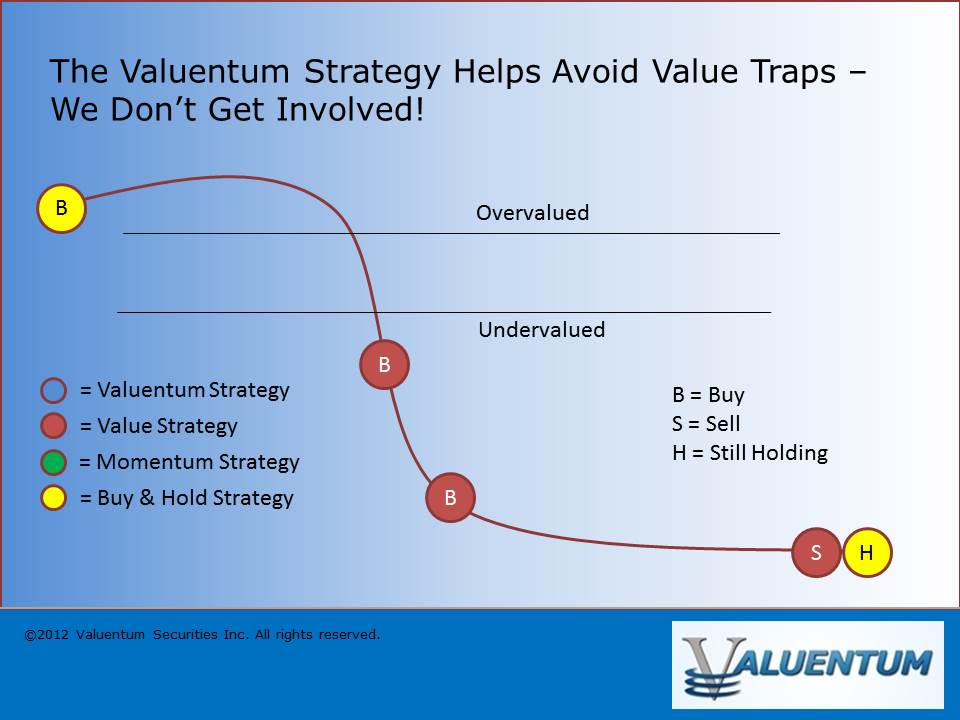
Image shown for informational/illustration purposes only. Furthermore, we think Valuentum subscribers are less likely to be involved in so-called value traps because we demand material revenue and earnings growth for firms to earn a 10 on the Valuentum Buying Index. Value traps often occur as a result of secular declines in a firm's products or services, resulting in deteriorating revenue and earnings trends (and often a falling stock price). We also think Valuentum subscribers are less likely to be exposed to these "falling knives" since the process requires firms to not only be undervalued, in our opinion, but also be exhibiting bullish technical and momentum indicators before we would consider adding them to the newsletter portfolios. Since the stock market is a forward-looking mechanism, price usually leads fundamentals. Without a turnaround in price, the risk that the fundamentals of an undervalued stock have not turned for the positive is higher. Where value strategies may encourage the buying of a stock all the way down regardless of whether fundamentals ever turn (red circles: Buy --> Sell), the Valuentum strategy attempts to steer clear of these situations. The Valuentum Buying Index is designed to wait for technical improvement in the equity, which often precedes fundamental changes at the company.
Image shown for informational/illustration purposes only. Let's walk through the three investment pillars of our stock-selection methodology. I. The Valuentum Buying Index Applies A Rigorous Discounted Cash Flow Valuation Process The Valuentum Buying Index methodology starts with in-depth financial statement analysis, where we derive our ValueCreation, ValueRisk, and ValueTrend ratings, which together provide a quantitative assessment of the strength of a firm's competitive advantages. We compare a company's return on invested capital (ROIC) to our estimate of its weighted average cost of capital (WACC) to assess whether it is creating economic profit for shareholders (ROIC less WACC equals economic profit). Firms that have improving economic profit spreads over their respective cost of capital score high on our ValueCreation and ValueTrend measures, while firms that have relatively stable returns score well with respect to our ValueRisk evaluation, which impacts our margin-of-safety assessment.
Image shown for informational/illustration purposes only. After evaluating historical trends, we then make full annual forecasts for each item on a company's income statement and balance sheet to arrive at a firm's future free cash flows. We derive a company-specific cost of equity (using a fundamental beta based on the expected uncertainty of key valuation drivers) and a cost of debt (considering the firm's capital structure and synthetic credit spread over the risk-free rate), culminating in our estimate of a company's weighted average cost of capital (WACC). We don't use a market price-derived beta, as we embrace market volatility, which may provide investors with opportunities to buy attractive stocks at bargain-basement levels, in our view. A forward-looking Economic Castle rating is then derived. Click here to view a sample stock report. We then assess each company within our three-stage free cash flow to the firm (enterprise cash flow) valuation model, which generates an estimate of a company's equity value per share based on its discounted future free cash flows and the company's net balance sheet impact, including other adjustments to equity value (namely pension and OPEB adjustments). Our ValueRisk rating, which considers the underlying uncertainty of the capacity of the firm to continue to generate value for shareholders, sets the margin of safety bands around this fair value estimate. For firms that are trading below the lower bound of our margin of safety band, we consider these companies undervalued based on our DCF process. For firms that are trading above the higher bound of our margin of safety band, we consider these companies overvalued based on our DCF process.
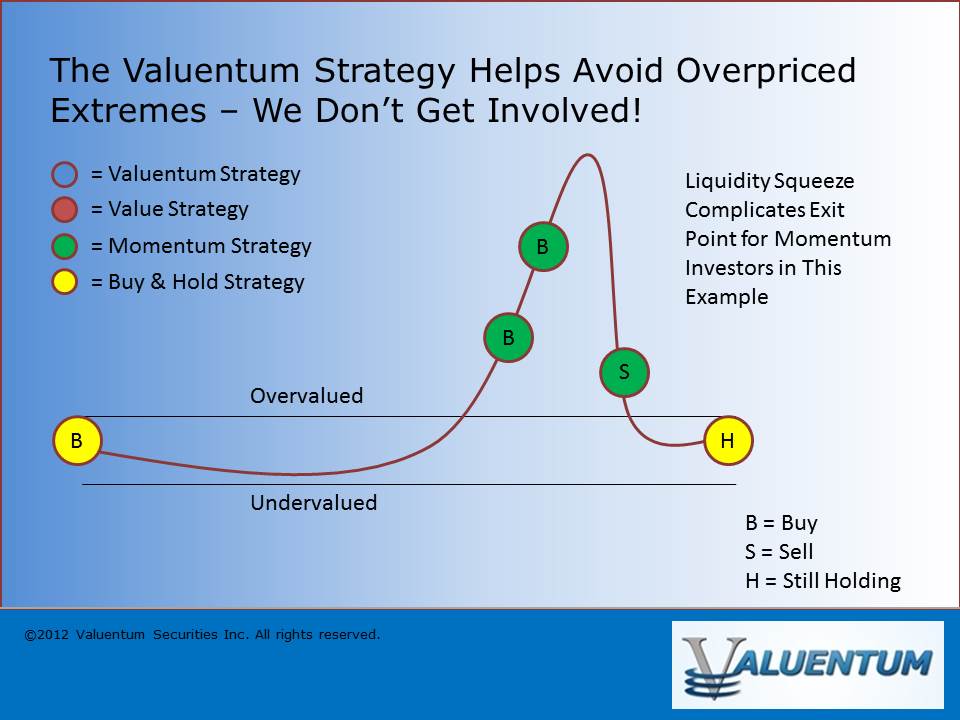
Download (pdf): "How Well Do Enterprise-Cash-Flow-Derived Fair Value Estimates Predict Future Stock Prices? -- And Thoughts on Behavioral Valuation" We think a focus on discounted cash-flow (DCF) valuation helps to prevent investors from exposing their portfolios to significantly overpriced stocks at their peaks. The image below reveals how pure momentum investors may expose their portfolios to pricing extremes and dramatic falls (green circles: Buy --> Sell). The Valuentum Buying Index attempts to steer clear from these situations.
Image shown for informational/illustration purposes only. II. The Valuentum Buying Index Incorporates A Forward-Looking Relative Value Assessment Our discounted cash-flow process allows us to arrive at an absolute view of the firm's intrinsic value. However, we also understand the critical importance of assessing firms on a relative value basis, versus both their industry and peers. Many institutional money-managers--those that drive stock prices--pay attention to a company's price-to-earnings (PE) ratio and price-earning-to-growth (PEG) ratio in making buy/sell decisions. With this in mind, we have included a forward-looking relative value assessment in our process to further augment our rigorous discounted cash-flow process. If a company is undervalued on both a price-to-earnings ratio and a price-earnings-to-growth (PEG) ratio versus industry peers, we would consider the firm to be attractive from a relative value standpoint. << Read President Brian Nelson's article on the Price-to-Earnings Ratio III. The Valuentum Buying Index Seeks to Avoid Value Traps, Falling Knives and Opportunity Cost Once we have estimated a firm's intrinsic value on the basis of our discounted cash-flow process, determined if it is undervalued according to its firm-specific margin of safety bands, and assessed whether it has relative value versus industry peers, we then evaluate the company's technical and momentum indicators in an attempt to consider entry and exit points on the stock (but only after it meets our stringent valuation criteria). Rigorous valuation analysis and technical analysis are not mutually exclusive, and we believe both can be used together to bolster idea generation. An evaluation of a stock's moving averages, relative strength, upside-downside volume, and money flow index are but a few considerations we look at with respect to a technical and momentum assessment of a company's stock. We embrace the idea that the future is inherently unpredictable and that not all fundamental factors can be included in a valuation model. By extension, we use technical and momentum analysis in an attempt to help safeguard against value traps, falling knives, and the opportunity cost of holding an undervalued equity for years before it potentially converges to "fair value." Other research firms may not consider opportunity cost as a legitimate expense for investors. Putting It All Together - the Valuentum Buying Index Though the time frame varies depending on each idea, on a theoretical basis, we would expect our best ideas to "work out" over a 12-24 month time horizon (on average) -- the duration of any individual idea can vary considerably, however. We tend to include firms in the Best Ideas Newsletter portfolio when they register a 9 or 10 on our Valuentum Buying Index (VBI) and tend to remove firms from the Best Ideas Newsletter portfolio when they register a 1 or 2 on the Valuentum Buying Index. In theory, the Valuentum Buying Index attempts to maximize profits on every idea within the Best Ideas Newsletter portfolio, with the understanding that momentum does exist and that prices over and under shoot intrinsic value all of the time. A value strategy (10 --> 5), for example, may truncate potential profits, while a momentum strategy (4 --> 1), for example, may ignore profits generated via value assessments. The Valuentum Buying Index seeks to capture the entire profit potential, as shown below.
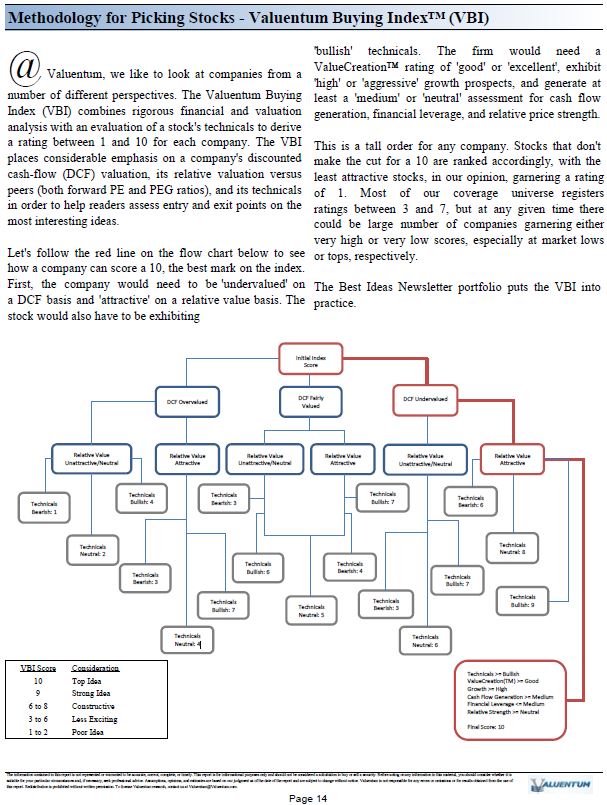
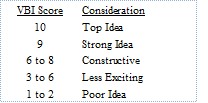
Image shown for informational/illustration purposes only. Let's follow the red line on the flow chart below to see how a firm can score a 10, the best mark on the Valuentum Buying Index. First, the company would need to be 'UNDERVALUED' on a DCF basis and 'ATTRACTIVE' on a relative value basis. The stock would also have to be exhibiting 'BULLISH' technicals. The firm would need a ValueCreation rating of 'GOOD' or 'EXCELLENT', exhibit 'HIGH' or 'AGGRESSIVE' growth prospects, and generate at least a 'MEDIUM' or 'NEUTRAL' assessment for cash flow generation, financial leverage, and relative price strength. This is a tall order for any company. Firms that don't make the cut for a 10 are ranked accordingly, with the least attractive stocks garnering a score of 1. Most of our coverage universe falls between 3 and 7, but at any given time there could be large number of companies garnering either high or low scores, especially at market lows or tops, respectively.
Image shown for informational purposes only. How We Use the Valuentum Buying Index in the Best Ideas Newsletter Portfolio << Back to Membership Page Join Now >> We often receive questions about how we use the Valuentum Buying Index (VBI) rating system, one of the key metrics we use to source ideas, but we think it is equally important to mention up front that it is only one of the many facets of our website and services. For example, if you haven't checked out the Dividend Cushion ratios on the stocks in your portfolio or the dividend growth product (from individual reports to the newsletter and beyond), surely you are not maximizing your membership! Don't forget about the Economic Castle rating and the Nelson Exclusive publication, too.
---
No matter your strategy or process though (it is not for us to say what is best for you), the Valuentum Buying Index rating system is still a helpful tool to have at your disposal, even if you are not using it. Admittedly, the VBI, as we call it, is not as easy to evaluate as 1, 2, 3, or even buying 9s and 10s and selling 1s and 2s until their VBI changes upon the next update. Generally speaking, we measure the process over longer-term time periods--from the time a company registers a rating to a defined time in the future--not an interim update basis.
---
The Valuentum Buying Index Has Checks and Balances
---
With prudence and care, the Valuentum Buying Index process and its components are carried out. Our analyst team spends most of its time thinking about the intrinsic value of companies within the context of a discounted cash-flow model and evaluating the risk profile of a company's revenue model. We have checks and balances, too. First, we use a fair value range in our valuation approach as we embrace the very important concept that value is a range and not a point estimate. A relative value overlay as the second pillar helps to add conviction in the discounted cash-flow process, while a technical and momentum overlay seeks to provide confirmation in all of the valuation work. There's a lot happening behind the scenes even before a VBI rating is published, but it will always be just one factor to consider.
---
Within any process, of course, we value the human, qualitative overlay, which captures a wealth of experience and common sense. We strive to surface our best ideas for members, and flying blind is never a good strategy, in our opinion. In probably one of the most obvious cases, for example, an experienced investor knows when a price-to-earnings (P/E) ratio isn't informative (as in the case of negative or negligible earnings), but a quantitative rating system that uses a P/E ratio may not know any better. That's why the VBI has checks and balances and focuses on the discounted cash-flow process first and foremost, but the human, qualitative overlay is still extremely important, especially when considering various business models and unique "un-modelable" risks. In our opinion, a golf club is only as good as the player that uses it, and in a similar light, a financial model or a rating system is only as good as the user that applies it.
---
That said, for the sake of transparency, we measure the performance* of the portfolios in the Best Ideas Newsletter and Dividend Growth Newsletter. The portfolios, in part, represent data points measuring the outcome of the work we do on the website, rolled into an assessment: our best ideas for each respective strategy. The ideas in the portfolios in the Best Ideas Newsletter and Dividend Growth Newsletter have been evaluated by our analyst team for consideration in the newsletter portfolios. The thoughts behind the weighting of each idea and the portfolio management process revealed in full transparency on a month to month basis may be worth the cost of a membership alone, even if you're not using the portfolios!
---
Here's why this is important. In a market environment where more than 90% of large-cap funds have trailed the S&P 500 in the 5-year period ending August 31, 2016, the Best Ideas Newsletter portfolio* has exceeded its benchmark return over a similar time period. What's more, we showcased this performance in full transparency, and we wrote every single day, and some days weren't all that great. When patience may be the secret to success in investing, a lot could have gone wrong with the temptation to do something each day. Obviously, we're very disciplined, but we also credit the portfolio outperformance to the VBI methodology itself. It is a very helpful tool.
-
* Actual results may differ from simulated information being presented. The High Yield Dividend Newsletter portfolio, ESG Newsletter portfolio, Best Ideas Newsletter portfolio and Dividend Growth Newsletter portfolio are not real money portfolios. Results, including those in the Exclusive publication, are hypothetical and do not represent actual trading. Valuentum is an investment research publishing company.
---
The Valuentum Buying Index Is One of Many Important Factors to Consider
---
That said, let's talk about how the VBI helps to inform which ideas we include in the Best Ideas Newsletter portfolio. This is where some clarification is probably important. For one, the word choice is critical, "inform," because the VBI is generally just one factor that goes into whether we add a company to the Best Ideas Newsletter portfolio, even if the VBI is one of the most important factors. Second, the timing element or duration concept is a key consideration. We've noticed via our statistical backtesting that a momentum factor can be much more pronounced (powerful) over longer periods of time. This was one of the interesting findings of our academic white paper study (2012). We try to consider this dynamic with the update cycle of our reports (and the time horizon for ideas to work out). That's why our reports are updated regularly or after material events and not daily or weekly. Perhaps most practically though, we don't think portfolio churn is the way to generate outperformance. Momentum may be high turnover, but Valuentum is low turnover.
---
Though the time frame varies depending on each idea that we consider for the Best Ideas Newsletter portfolio, we would expect our best ideas to generally work out over a 12-24 month time horizon (on average). Not all ideas will be successful, however. Our "holding period" is targeted to be much, much longer for some ideas in the Dividend Growth Newsletter portfolio, as income and dividend growth are other key factors (in addition to the Valuentum Buying Index and capital appreciation potential). The time horizon or duration concept is where the Valuentum Buying Index rating system becomes more complicated than a simple 1, 2, 3. For example, we tend to "add" stocks to the Best Ideas Newsletter portfolio when they register a 9 or 10 on the Valuentum Buying Index (VBI), "hold" them for some time depending on a number of variables (the VBI, market conditions, sector weightings within the portfolio itself), and then we tend to "remove" stocks from our Best Ideas Newsletter portfolio when they register a 1 or 2 on the VBI. You'll notice that we have a qualitative overlay for the Best Ideas Newsletter portfolio (and one for the Dividend Growth Newsletter portfolio, too, based on dividend-related considerations).
---
 Image shown for informational/illustration purposes only. Valuentum is an investment research publishing company. --- But why don't we churn our ideas by updating daily and trading a lot? Obviously, we don't think that's the secret to investment success. In quite the opposite approach, we strive to maximize profits on every idea that we pursue, with the understanding that momentum does exist and that prices over and under shoot intrinsic value all of the time. For example, as shown in the image above, a value strategy (10 --> 5) truncates potential profits, while a momentum strategy (4 --> 1) ignores profits generated via value assessments. At Valuentum, we're after the entire profit potential of each idea. So, for example, if a firm is added to the Best Ideas Newsletter portfolio as a 10 and is removed as a 5, we would have truncated profit potential by not letting it run to lower ratings. Most of our highly-rated Valuentum Buying Index rated stocks have generated the "outperformance" of the Best Ideas Newsletter portfolio, but these stocks' ratings declined over time as they were held (a good thing -- a declining VBI rating generally means the share price has advanced, assuming all else is well). ---
 Image shown for informational/illustration purposes only. Valuentum is an investment research publishing company. --- Not All Highly-Rated Stocks Are Added to the Newsletter Portfolios
---
Regarding the Valuentum process, as it is executed in the Best Ideas Newsletter portfolio, we do not "add" all stocks that register a 9 or 10, nor do we add the ones we do immediately thereafter. For example, Google (GOOG, GOOGL), now Alphabet, a current Best Ideas Newsletter portfolio "holding," registered a 10 on the Valuentum Buying Index, but we remained patient and didn't "add" the company to our portfolio until after it reported earnings at the time, providing us with an even better entry point (as new information came to light). There are more "structural/timing" instances like the one with Alphabet, for example, that are extremely difficult to capture in any model, and understandably aren't as obvious to those outside looking in. Macro-economic, broader market valuation, and sector weighting considerations are other factors that impact the qualitative portfolio management process.
---
But why not add every highly-rated stock on the Valuentum Buying Index to the Best Ideas Newsletter portfolio? Think of it as if you were to imagine a value investor not adding and holding every undervalued stock to his/her portfolio. He or she wants the very best ones, in his or her opinion -- obviously, that means having to leave some good ideas behind. And then, of course, there are always tactical and sector weighting considerations in any portfolio construction, yet another reason why the human touch remains a vital aspect of the Valuentum process. At the core of how we use the VBI in the Best Ideas Newsletter portfolio, however, is a qualitative portfolio management overlay. The VBI rating helps to inform the process, but the Valuentum team makes the allocation decisions of the newsletter portfolio on the basis of a number of other firm-specific and portfolio criteria. Sometimes, under certain market conditions, we may even have to relax the VBI criteria entirely in order to do what we think is required to achieve newsletter portfolio goals.
---
Some Examples of the Valuentum Buying Index In Action
---
Okay, a couple examples. Take pre-split eBay (EBAY), which many years ago included PayPal (PYPL), as an example of our process in action. The stock initially flashed a rating of 10 in late September 2011, and we "added" it to the Best Ideas Newsletter portfolio. The VBI rating changed to a 6 in December 2011 and then back to a 10 in May 2012, but because the rating never breached a 1 or 2, we did not remove the position from the Best Ideas Newsletter portfolio. In the case of pre-split eBay, we sought to capture the entire pricing cycle and avoided truncating it as most pure value investors often do (and what we would had done, if we had removed the stock at that time). In many ways, pre-split eBay/PayPal has become one of the better examples to use for illustrating the prolonged outperformance driven by undervalued stocks that are beginning to generate good momentum. [We no longer include eBay or PayPal in the newsletter portfolio.]
---
There have been more straightforward opportunities in the Best Ideas Newsletter portfolio, too, especially in the case of EDAC Tech, which tripled since it was added to the newsletter portfolio (never registering below a 9 along the way), and then of course, Apple (APPL), Visa (V) and Altria (MO), but it is usually through the nuances of the process that one truly comes to understand it (as in the eBay example). Not to be overlooked either, the Valuentum Buying Index rating also informs us when we may consider "removing" a position from the newsletter portfolios. Kinder Morgan (KMI), for example, registered a 1 on the Valuentum Buying Index just prior to its notorious fall and dividend cut. The VBI ratings on each stock's most recent 16-page report, downloadable directly from the website at www.valuentum.com, reflect our current opinion on the company.
---
In all, the Valuentum Buying Index rating system, as with all methodologies, helps to inform the investment decision process, but in constructing the newsletter portfolio, a qualitative overlay is not only necessary, in our view, but helps to optimize performance. If the returns of the Best Ideas Newsletter portfolio during the past 5+ years are any measure of the VBI rating system, it is performing fantastically well. Of course, please always contact your financial advisor to determine if any idea or strategy may be right for you.
---
* Actual results may differ from simulated information being presented. The High Yield Dividend Newsletter portfolio, ESG Newsletter portfolio, Best Ideas Newsletter portfolio and Dividend Growth Newsletter portfolio are not real money portfolios. Results, including those in the Exclusive publication, are hypothetical and do not represent actual trading. Valuentum is an investment research publishing company.
---
Valuentum Buying Index methodology originally published June 21, 2011.
---------------------------------------- About Our Name But how, you will ask, does one decide what [stocks are] "attractive"? Most analysts feel they must choose between two approaches customarily thought to be in opposition: "value" and "growth,"...We view that as fuzzy thinking...Growth is always a component of value [and] the very term "value investing" is redundant. -- Warren Buffett, Berkshire Hathaway annual report, 1992 At Valuentum, we take Buffett's thoughts one step further. We think the best opportunities arise from an understanding of a variety of investing disciplines in order to identify the most attractive stocks at any given time. Valuentum therefore analyzes each stock across a wide spectrum of philosophies, from deep value through momentum investing. And a combination of the two approaches found on each side of the spectrum (value/momentum) in a name couldn't be more representative of what our analysts do here; hence, we're called Valuentum. -------------------------------------------------- Valuentum has developed a user-friendly, discounted cash-flow model that you can use to value any operating company that you wish. Click here to buy this individual-investor-friendly model now! It could be the best investment you make. |


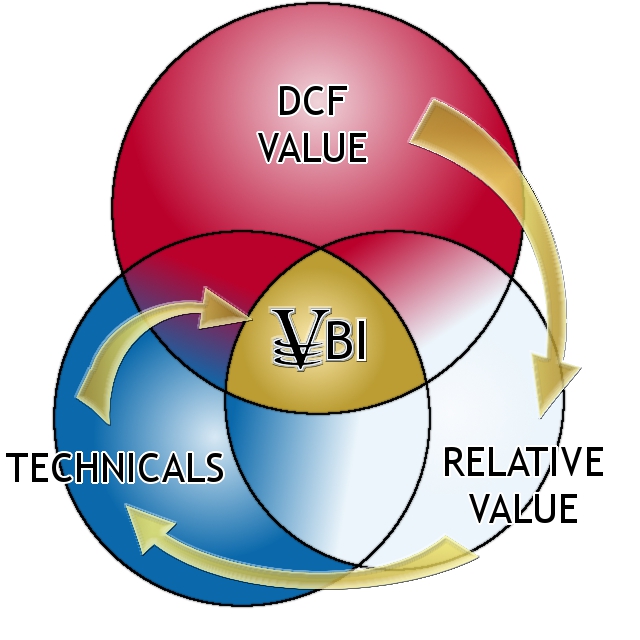
 The center of the Venn diagram above, the Valuentum Buying Index (VBI) combines