Member LoginDividend CushionValue Trap
|
The Price-to-Earnings Ratio Demystified
publication date: Jan 1, 2025
|
author/source: Brian Nelson, CFA
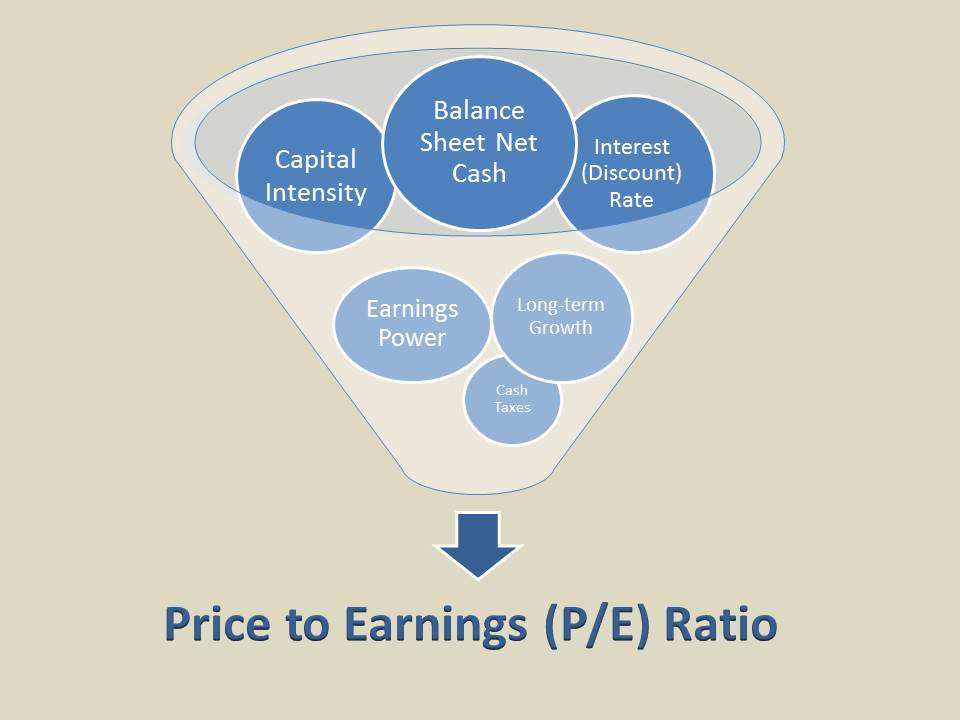
By Brian Nelson, CFA The Price-to-Earnings Ratio Demystified The price-to-earnings (P/E) ratio seems so easy, right? The trailing P/E is just the price per share of the stock divided by the annual net diluted earnings per share the firm generated in its last fiscal (calendar) year. The forward P/E is the price per share of the stock divided by next fiscal (calendar) year’s annual net diluted earnings per share of the firm (or the forward 12-month period). The P/E ratio is probably the most well-known measure to help investors compare how cheap or expensive a firm’s shares are, as stock prices, for lack of a better term, are arbitrary. For example, stocks such as Warren Buffett’s Berkshire Hathaway (BRK.A), which has never split its stock, have traded over $600,000 per share, while other well-known companies such as Amcor plc (AMCR) and Dish Network Corp. (DISH) can trade for just a few bucks per share. Citigroup (C) was once a penny stock before its 10-to-1 reverse split in 2011, while General Electric's (GE) underwent a 1-for-8 reverse stock split that adjusted its shares above $100 in 2021. Apple (AAPL) is probably the most high-profile example. The company effected a 7:1 stock split June 2014. It’s only when investors compare a firm’s share price to its annual net diluted earnings per share that they believe they can get some sense for whether a company’s shares are expensive (overvalued, overpriced) or cheap (undervalued, underpriced). The higher the P/E, it is believed the more expensive the company’s stock--all else equal. This seems way too simple, so why would we (or better yet, how could we) devote so much time to talking about such a basic financial concept? Well, the truth is that the P/E ratio is not as simple as one thinks (and even some of the most seasoned investors continue to use this powerful multiple incorrectly). Let's dig in. How the P/E Ratio Is Used Incorrectly As Valuentum members know, the second pillar of our Valuentum Buying Index considers a company’s forward P/E ratio by comparing this measure to that of its industry peers to determine if the company is trading at a comparatively attractive valuation. The forward PE in the 16-page stock reports represents the company's stock price, as of the date of the report, divided by its forward earnings per share. If the firm’s P/E is lower than its peer median, an investor is paying less per unit of earnings than the median of its peer group. Investors are getting a good deal in this case, all else equal, right? Well, the problem is that companies are never equal, and even comparisons among firms that are in the same industry can be misleading, as they may have varying competitive advantages influencing the sustainability of earnings or require varying levels of reinvested capital to generate the same amount of earnings. It is also inappropriate for investors to apply a company’s historical median (or average) price-to-earnings ratio to the same firm’s future earnings stream. But why? It’s the same stock. Shouldn’t it be relevant and applicable? Well, yes and no. For starters, it’s great for investors to have an idea of what “multiple range” a company has traded at in the past – there’s a lot of value to this, and most relevant for cyclical firms (mainly industrials) that may, from a fundamental standpoint, exhibit similar (but not identical) patterns with respect to both earnings and their P/E through the course of each economic cycle. Think Boeing (BA) and the commercial aerospace cycle; Ford (F) and consumer demand for auto sales; or United Continental (UAL) with respect to premium air travel demand. But for less-cyclical firms (and even for cyclicals where structural industry dynamics have altered over time), investors are wrongly assuming that the forward outlook of the past (which determined the historical multiple) will be the same as the forward outlook of the present (which determines the current multiple). This, unfortunately, is never true. So what is an investor to do? We know that it’s imperfect to compare a company’s current or forward P/E ratio to its peers or even to the median or average of its peers. No two firms are identical. And it’s even more imperfect to compare a company’s current or forward price-to-earnings ratio to its historical measure. Look at Apple’s outlook in 2002 versus its outlook in 2009 and its outlook today – a lot different, would you say? One wouldn’t apply the same multiple to Apple's earnings in each of these years, or if one did, it would be for different reasons/underlying factors. We also believe that comparing a firm's P/E to the average market multiple, while sometimes helpful, is imprecise. A firm is simply different than the aggregate market, so how can this comparison be significantly relevant, right? With All of Its Faults, Why Do We Use the P/E Ratio Then? Okay, you may then ask: why does Valuentum use a P/E ratio at all in its process if the measure is so imperfect? The answer rests in what drives stock prices. Not all investors use a discounted cash-flow (DCF) process to value equities, and as a result, they resort to the short-form P/E ratio to sometimes make decisions. We often seen multiples used extensively in quantitative research and analysis. There exists, as a result, what we’d describe to be self-fulfilling market forces (buying and selling) that make the price-to-earnings ratio a meaningful consideration. We call this behavioral valuation. In other words, if Portfolio Manager A likes a stock because its P/E ratio is trading at the lower end of its historical P/E valuation range or is trading at a discount to its peers’ average P/E, he/she might buy it, and this buying pressure itself causes the stock to rise, therefore making the P/E in this form a relevant consideration for investors. This idea hits at the heart of the Valuentum process--striving to have an understanding of all market forces (investment philosophies) that drive stock prices, such that we can highlight them for members. For this reason, we include a relative value assessment in the Valuentum Buying Index, and the forward P/E and PEG (price-earnings-to-growth) ratios, more specifically. Cash Flows Tell a More Accurate Story So, with that said, how do we look at the P/E? Valuentum followers know that we use a discounted cash-flow (DCF) valuation process (the first pillar of our Valuentum Buying Index) to uncover an estimate of the intrinsic worth of every non-financial, operating company in our coverage universe. Okay, now one may ask: “Why do you use a free cash flow model when stock prices are driven by earnings?" After all, we just defined the stock price as a function of its earnings and a P/E multiple (the share price divided by net diluted earnings per share is the P/E)? Well, yes. But earnings are a component of cash flow, and evaluating future free cash flows has more benefits (net income is a component of cash flow from operations). For starters, the variations between earnings and cash flow not only arise in working capital changes over time (their influence on a firm’s cash flow from operations), but also in the timing of the cost of replacing those assets that generate earnings (capital expenditures versus depreciation). Plus, varying levels of interest rates paid on debt loads can also muddy the water on earnings--not to mention that there are various analytical ways to account for rent expense (whether to capitalize such assets or to allow the expense to flow through the operating line). So there are some major differences between assessing a company’s value based on earnings versus based on using a discounted cash-flow model. Because earnings quality (are earnings being converted to cash flow?) and capital efficiency (how much capital needs to be plowed back into the firm to maintain earnings) are critical to assessing the health of a company and its valuation, using free cash flow to evaluate companies is a better, more comprehensive process. The DCF-Derived P/E Ratio is Not Observed From Prices; It Is Derived From Cash Flows As we outlined, a P/E ratio is traditionally observed by dividing a company's stock price by its earnings to determine if the stock is cheap or expensive. For example, if a company is trading at $100 per share and its net diluted earnings-per-share for next year is estimated at $10, the firm is trading at 10 times forward earnings. Many investors may say this stock is cheap in comparing it to the market multiple of ~15-18 times forward earnings, for example. We've addressed the pitfalls of doing so--every company is different with respect to expected sustainability of earnings and the capital-intensity required to generate such earnings and other factors (including its net debt position). Though the P/E ratio is an output in price-observed analysis (and in many quantitative applications), the discounted cash-flow model solves what the firm should be trading at on the basis of its unique fundamentals. The discounted-cash-flow-derived P/E (or value-derived P/E) represents the difference between saying a firm is trading at 20 times earnings, as in the case of a price-observed process, and saying a firm should be trading at 20 times earnings on the basis of its future expected free cash flows and its balance sheet (net cash or net debt position). A stock observed to be trading on the market at 20 times forward earnings may be cheap or expensive, but a stock trading at 20 times forward earnings whose discounted cash-flow derived fair value estimate supports such a multiple is fairly valued. The former represents the multiple that speculators are willing to pay for shares, while the latter represents what multiple should be placed on earnings to approximate what the company is worth. In order to solve the P/E multiple that is most appropriate to place on a company’s future earnings stream (its net diluted earnings per share), one must use a discounted cash flow process to do so. The "correct" P/E cannot be observed in the market. It must be derived via the DCF construct. By calculating the present value of a company’s future enterprise free cash flows (free cash flows to the firm), considering the firm’s net balance sheet impact (cash less debt) and making other adjustments, one arrives at an estimate of the company's intrinsic equity value. In dividing intrinsic equity value by diluted shares outstanding, the investor then arrives at equity value per share. Taking this equity value per share and dividing it by next fiscal year’s earnings of the company leaves one with the forward price-to-earnings (P/E) ratio. Because a discounted cash-flow process captures the unique intricacies of the exact company one is modeling at the exact time one is modeling it (and taking into consideration all future factors at the time), it is far superior to any relative peer or historical P/E multiple analysis. Why We’re Fans of the Discounted Free Cash Flow Model By now, you can probably see why we’re such big fans of using a discounted free cash flow valuation model. Though there are many, many ways of looking at a stock--in fact, varying perspectives remain core to our process--using a free cash flow process is perhaps one of the only ways investors can arrive at the “correct” intrinsic P/E multiple to place on a company’s future expected earnings. Let’s examine this even further. Have you ever wondered why capital-light companies (software, advertising companies) garner higher earnings multiples than capital-intensive companies (auto manufacturers)? Well, capital-intensive companies have to re-invest a significant amount of earnings back into their businesses, thereby reducing future free cash flow, and by extension, the P/E multiple that investors are willing to pay for that earnings stream. Simply put, not all earnings streams are created equal--even given equivalent future expected growth trajectories in them. Investors should prefer the earnings stream in this case that requires the least amount of re-invested maintenance capital. The discounted cash-flow process will also uncover situations where the health of a company's balance sheet will impact the "correct" P/E multiple to place on a company's earnings stream. For example, all else equal, firms with billions in net cash should garner higher P/E multiples than firms with billions in net debt. The net balance sheet position is captured in a discounted cash-flow process, but it is not readily apparent in any P/E multiple assessment that only considers a firm's stock price and its earnings per share. In fact, many stocks with huge net debt positions have very low P/E ratios, and for good reason! Net debt is a reduction to a company's enterprise value in depressing equity value relative to future expected earnings. In such cases, these low P/E stocks aren't cheap at all and can often be viewed as value traps. Nuts & Bolts At this point, we hope that we have at least convinced you to be careful about arbitrarily placing a P/E multiple on a company’s earnings to arrive at a target price (fair value). Even if that multiple is based on historical ranges (medians or averages) or is comparable to industry peers or the market as a whole, investors fall short of capturing the uniqueness of a company’s future cash flow stream and balance sheet via a discounted cash flow process, which considers all of the qualitative factors of a company--from a competitive assessment to the company's efficiency initiatives and beyond. Using a discounted free cash flow model "forces" investors to think about the key valuation drivers of a company long into the future, thereby reinforcing forward-looking analysis and a critical understanding of what we’d describe as needle-moving inputs (revenue, WACC, etc.). Below is a helpful definition of the P/E ratio. This is the P/E ratio that drives what a company should be trading at on the basis of its firm-specific fundamentals. You’ll notice that the PE ratio is forward-looking and considers a variety of different components: Forward Price-to-Earnings (P/E) Ratio = {[(Sum of Discounted Future Enterprise Free Cash Flows – Total Debt – Preferred Stock + Total Cash)/Shares Outstanding]/ Next Fiscal Year’s Earnings Per Share} Upon examination of the definition of the P/E ratio above, one can see that a P/E ratio is a short-form discounted cash-flow model. The numerator defines how one calculates the fair value estimate of a company's shares, while the denominator uses expected net diluted earnings per share. The discounted cash-flow (DCF) process solves what a firm's shares should be trading at -- it represents the multiple that is applied to the company's earnings: the P/E multiple. What Are the Drivers of a Company’s Stock Price? Because the P/E ratio is also a function of the price of a stock as we outlined at the very beginning of this article (stock price divided by earnings), the factors of a discounted cash-flow (DCF) model, the numerator of the definition above, are also the drivers behind the firm's stock price. Below, we show how a number of qualitative factors influence the P/E multiple and (by extension) stock prices and whether each factor is positively or negatively correlated to a company's intrinsic value and stock price. You'll notice the list is much more comprehensive than what many investors point to as the main reason for different P/E ratios, namely future expected earnings growth. Revenue Growth: Impacts Future Enterprise Cash Flows (Mostly Positive) Operating Earnings Growth: Impacts Future Enterprise Cash Flows (Positive) Taxes: Impacts After-tax Earnings; Cost of Debt (Mostly Negative) Capital Expenditures: Impacts Future Enterprise Cash Flows (Negative) Return on Invested Capital (ROIC): Function of Operating Earnings and Net New Investment, Capital Expenditures (Positive) Risk-free Rate, 10-year Treasury: Impacts WACC (Negative) Discount Rate (WACC): Impacts Present Value of Enterprise Cash Flows (Negative) Total Debt: Impacts Enterprise Value and Discount Rate (Mostly Negative) Preferred Stock: Impacts Enterprise Value and Discount Rate (Mostly Negative) Total Cash: Impacts Enterprise Value (Positive) Shares Outstanding: Changes in Shares Outstanding (Neutral, assuming reinvestments' ROIC equal the firm’s WACC) Key Takeaways The key takeaways are: 1) without using a discounted cash-flow model, the P/E ratio that should be applied to a company's future expected earnings stream can never be appropriately calculated, and by extension, 2) when investors assign an arbitrary price-to-earnings multiple to a company’s earnings (based on historical trends or industry peers or the market multiple), they are essentially making estimates for all of the drivers behind a discounted cash-flow model in one fell swoop (and sometimes hastily). As earnings for next year are often within sight and can be estimated with some confidence (though this certainly varies among firms), calculating the price-to-earnings ratio via a discounted cash-flow process, in our opinion, is of far greater importance than worrying about whether a firm will beat or miss earnings in its next fiscal year. Because the P/E ratio is a discounted cash-flow model that considers the long-term qualitative dynamics of a particular entity, cash-flow analysis remains the first and most important pillar of our Valuentum Buying Index. And finally, investors cannot ignore valuation analysis or the future. Valuation is an important driver behind stock prices, and it is based on future expectations that can only be estimated. This is just a fact of the markets. Thank you for reading! NOW READ: The Real Reason Why Moats Matter ---------- It's Here!
The Second Edition of Value Trap! Order today!
 -----
A version of this article first appeared on our website June 9, 2013. Tickerized for the top holdings in the WisdomTree Low P/E Index. Brian Nelson owns shares in SPY, SCHG, QQQ, DIA, VOT, RSP, and IWM. Valuentum owns SPY, SCHG, QQQ, VOO, and DIA. Brian Nelson's household owns shares in HON, DIS, HAS, NKE, DIA, RSP, SCHG, QQQ, QQQM, and VOO. Some of the other securities written about in this article may be included in Valuentum's simulated newsletter portfolios. Contact Valuentum for more information about its editorial policies. Valuentum members have access to our 16-page stock reports, Valuentum Buying Index ratings, Dividend Cushion ratios, fair value estimates and ranges, dividend reports and more. Not a member? Subscribe today. The first 14 days are free. |