Image Source: Lindsay Holmwood
Let’s examine how we derive the forecasts in our stock and dividend reports.
This article appeared on our website April 2014. It is updated and refreshed today for the benefit of new members.
By Kris Rosemann and Brian Nelson, CFA
One of the biggest benefits of being a member of Valuentum’s investment services is that we show you all of the numbers – the numbers tell the real story.
An author/analyst may tell the story of a company through his/her eyes, but the author/analyst must still convert his/her thoughts and qualitative considerations into quantitative future forecasts to arrive at a fair value estimate of a stock. These future forecasts ultimately determine an intrinsic value estimate of the equity. Without an in-depth valuation process on the basis of future free cash flows, stock analysis is a story that has no end…no tangible conclusion, in our view.
Sometimes readers may not want to see all of data (at times, it can be overwhelming), but we think it’s important that investors know it’s here at Valuentum. Investors are learning that most of the articles found on the web today do not have a robust cash-flow valuation process – or any robust and systematically-reviewed valuation process – supporting the conclusions.
Buying a stock after reading an article without examining its valuation model is like buying a house without examining the foundation. The house may look pretty on the outside, but there’s really nothing supporting it. You may get lucky and be on sturdy ground, or you may not. Just like we don’t want our house to sink, we don’t want our stocks to collapse either.
You can find our earnings estimates and the hundreds of assumptions we include to arrive at a fair value estimate in our 16-page reports, or if you want to take a fully-populated discounted cash-flow model for a test drive, we make this unique feature available through our Financial Advisor plan (upgrade here). You can use the same models our analyst team uses!
Why are we writing this article?
We’re writing this article to show you just how transparent we are as a research publisher (we think this is a good thing) and why we do the things we do. A recent study by the CFA Institute revealed that trust is far and away the most important consideration for an investment service, and we hear you. We don’t take our responsibilities lightly.
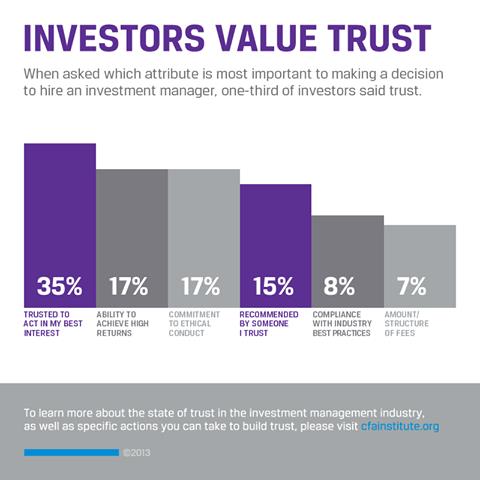
Source: http://www.cfainstitute.org/learning/future/about/pages/investor_trust_study.aspx
That said, the best place to start with how we think about forecasts is with a statement that may shock you: There are roughly 40 analysts deriving Google’s, now Alphabet’s (GOOG, GOOGL) earnings estimates for this year alone. And the large number of analysts isn’t a phenomenon unique to Alphabet or just large companies – it’s like this for almost every mid/large cap. F5 (FFIV), for example, has nearly 30. Some of the analysts will be right some of the time, and some of the analysts will be wrong some of the time. It’s just the way the stock-research business works. No analyst is right all of the time.
But that shouldn’t be the takeaway from this article. Investors already know analysts are not perfect (that’s why there are earnings beats and misses all the time). Still, we think it is quite informative to examine where these analysts are focusing their attention. Below, please find a snapshot of the earnings-estimate distribution from these analysts, courtesy of FactSet (as of October 2013).
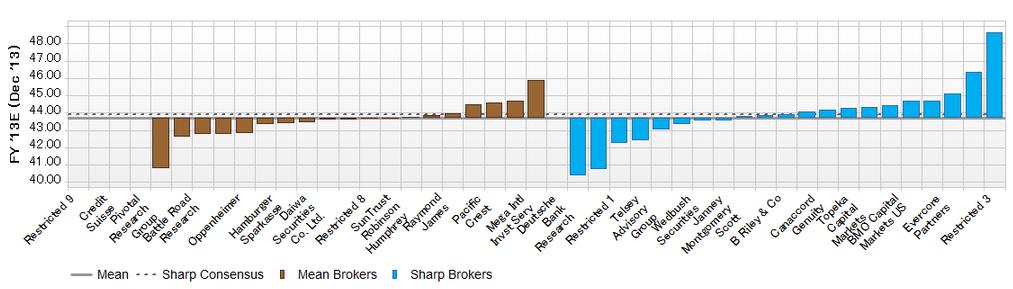
Image Source: FactSet
At the time this article was originally written, you’ll see some research firms are pessimistic about the year’s earnings estimate of Alphabet relative to consensus and some firms are optimistic. The range of earnings estimates is $41-$48 per share for fiscal year 2013 (at the time, our forecast was $44 per share). More than 40 analysts are all looking at the year’s performance and making an estimate.
Are we interested in competing with 40 other analysis on this year’s numbers? No. First of all, we don’t think we could do a better job than these 40 analysts collectively – just like we don’t think we could beat out the ultra-fast algorithmic traders – nor do we want to. Believe us — we make earnings estimates. We’ve been in the ballpark at times, and we’ve been wrong at times. But we can tell you with certainty – next year’s earnings have little influence on estimating the “true” long-term intrinsic value of a stock.
Most money managers will try to find an analyst that they think is good – one that predicts earnings surprises or is a good fit for their strategy (think growth, value, momentum). Though there is value to this, we’re more interested in getting our fair value estimates “correct” and delivering information regarding the Valuentum Buying Index rating that we think helps to identify future stock price movements. As we outline in the “16 Most Important Steps to Understand the Stock Market”, “playing games” with earnings estimates is not the driver behind long-term stock prices (logically, it doesn’t make sense):
Let’s ask ourselves these two questions: What if a company continues to miss earnings expectations every quarter into infinity? Will its stock price keep going down forever until it reaches 0? The answer simply is no. Stock prices are determined by expectations of future earnings and cash flow. A company will still have value even if it continues to miss earnings. Consensus estimates and even whisper numbers move around often. And I’ve even heard of some speculation that some analysts actually raise their target prices and lower earnings estimates (at the same time for the same company), so that specific company can beat estimates (and hopefully traders drive the stock price higher to their target price, so they look smart). This can’t be true, right? Well-seasoned market participants may know about this potential conflict and what I am talking about.
Simply put, we just don’t see much value in spending our time competing with 40 other analysts (on Alphabet alone), where a lot of them will be wrong. Therefore, within our discounted cash-flow valuation models, our top- and bottom-line forecasts for the next two years, do not vary much from consensus estimates or management’s provided guidance. Where we do differentiate ourselves is in the intermediate- and long-term forecasts that are more important to the derivation of a fair value estimate, in our view.
Please examine the distribution of a company’s equity value, per Alphabet’s 16-page report from May 2017 below. Roughly $117 billion (17%) of the company’s equity value comes from value generated during the next five years, $308.3 billion (45%) from years 6-20, $77.2 billion (26%) from perpetuity, and the balance from its balance sheet position. For a company such as Alphabet, one that generates gobs of free cash flow annually, a long-term focus has even more credence. We believe ignoring the analysis of the composition of value generated outside of the next five years does investors a tremendous disservice in evaluating the “true” intrinsic worth of a firm.
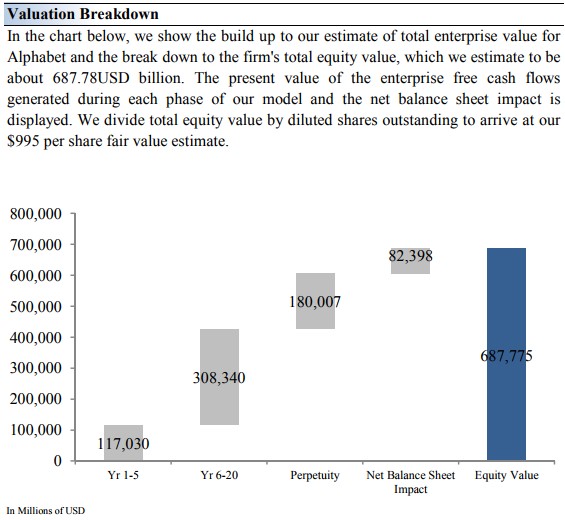
Source: Alphabet’s 16-page equity report, 5/13/2017
Traditional brokerage analysts may be spending the majority of their time analyzing fundamentals over the next few years, a time frame that accounts for less than one fifth of Alphabet’s equity value (see image above). We like to spend the majority of our time looking just past the focus of those 40 analysts, the area in which the most value is created. What this means is that we don’t care to differ much from consensus estimates during the next couple years – it’s not where we’re going to “win the game” or where most of the value composition is generated. As a result, we’re laser-focused on striving to get our long-term assumptions “correct” — a time frame that some market participants may not even be looking at closely!
Within our 16-page stock and dividend reports, our fair value estimates for companies reflect the base-case scenario of our expectations for the company (they do and should not represent an optimistic case or a pessimistic case, but the scenario that we think has the highest probability of occurring). That said, we’re well aware that valuation, because it is forward-looking in nature, is not a precise exercise, and the upside and downside cases of our forecasts result in our fair value range for each company (encapsulating the concept of a margin of safety). The intrinsic value of a company will always be a function of the probability of its fair value outcomes.
If you have any questions about how we derive our assumptions within our valuation model, please contact us at info@valuentum.com. If you’re using our valuation model template, you may find some helpful commentary in the model Q&A on our discussion board here.
How do we think about the dividend growth rates we assign to stocks?
“No board of directors is going to openly say that its firm’s dividend is weak.”
In the same light, forecasting dividend growth rates is not an exact science either. For one, the board of directors can choose to raise or lower the dividend at any time it wants, regardless of dividend policy or previous statements. Take the Kinder Morgan (KMI) story of 2015, for example. Management released a press release December 4, 2015, stating that it expected to generate sufficient distributable cash flow (an industry-specific metric we cover in great detail here) to remain on track with its planned 2016 annual dividend hike of 10%. However, less than one week later, December 8, 2015, the company announced a ~75% cut to its originally planned payout for 2016.
Though Kinder Morgan was not in material risk of bankruptcy, maintaining adequate cash flow outside of the payout was necessary for the ongoing healthy functioning of its business, specifically in maintaining a strong credit rating. As you may know, we arguably made one of the best stock calls in recent memory by “removing” the position of Kinder Morgan from the simulated Dividend Growth Newsletter portfolio in June of that year. Others have not been so lucky. In fact, every company that has previously paid a dividend or distribution and has subsequently filed for bankruptcy can look to a board that either was too optimistic about the company’s fortunes or did not accurately anticipate the fundamental risks.
As a result, our goal with respect to our dividend forecasts in the dividend reports is to separate ourselves from board decision-making, which could cloud an independent judgment. Instead, we strive to estimate what we think is an achievable growth rate in the firm’s dividend per share on the basis of the company’s Dividend Cushion ratio and the willingness of management to continue raising it by assessing the consistency and pace of dividend growth in the past. For illustrative purposes, please see the historical trends in McDonald’s (MCD) dividend-per-share and our future forecasts in the payout over the next few years. This information can be found in each company’s dividend report that we make available.
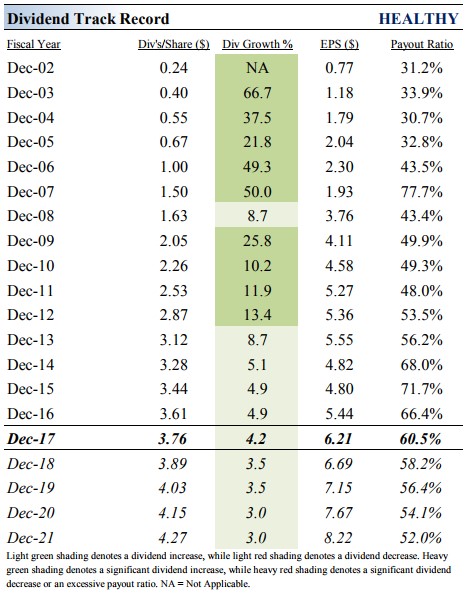
Source: Valuentum, McDonald’s (MCD) Dividend Report
In some cases, our dividend growth forecasts will not precisely match what a board plans to do with its dividend in the future. We genuinely want to provide readers with an independent opinion of the financial strength of a company’s dividend–and what we think is a reasonable annual growth rate to expect on the basis of the company’s cash-flow profile, balance sheet health, and dividend track record.
After all, no board of directors is going to openly say that its dividend is weak, and that’s why we think an independent assessment holds tremendous value for readers. Our voice is an unbiased opinion based on hard numbers within our discounted cash-flow models. Though there are a variety of exceptions, the future dividend growth rates that we assign to the end of our discrete forecast horizon (2021, in the case of McDonald’s above) are generally aligned to the following scale.
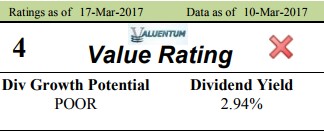
Dividend Growth Potential
Excellent: 8% or higher
Good: 4%-8%
Poor: 2%-4%
Very Poor: 0%-2%