
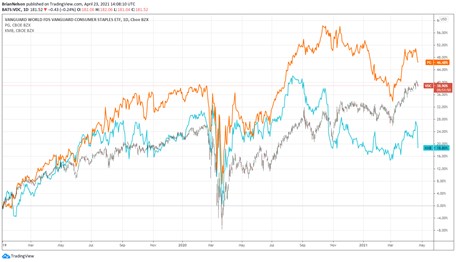
Image Shown: Since the beginning of 2019, on a price-only basis, Procter & Gamble (orange) has handily outpaced the Vanguard Consumer Staples ETF while Kimberly-Clark (turquoise) has stumbled.
Brian Nelson, CFA
Consumer staples (VDC) stocks are known for the stability of their demand profiles, strong and recognizable household brand names, and solid dividend growth track records. Procter & Gamble (PG) may be among the most recognizable names across the sector, but Kimberly-Clark (KMB) is not far behind. Their share prices, however, tell two different stories since the beginning of 2019.
In P&G’s third-quarter fiscal 2021 report (calendar first quarter), issued April 20, the company posted a net sales increase of 5% and diluted net earnings per share expansion of 13%, to $1.26, versus the prior-year quarter. Free cash flow generation was robust in the period, and the company’s recent 10% dividend hike marks its 65th consecutive year it has raised the payout. P&G has been paying a dividend since it was founded in 1890.
P&G’s outlook is quite robust, too, with fiscal 2021 all-in and organic revenue growth anticipated in the range of 5%-6% and core earnings per share growth expected in the range of 8%-10% versus fiscal 2020 core EPS numbers of $5.12. The company expects to pay more than $8 billion in dividends and buy back ~$11 billion in stock during the fiscal year. P&G is also raising prices across its ‘Baby Care.’ ‘Feminine Care,’ and ‘Adult Incontinence’ product categories in the US to offset rising input costs.
Contrast this with Kimberly-Clark, whose first-quarter 2021 results, issued April 21, showed net sales falling 5% from the year-ago period with organic revenue dropping at an 8% pace. For the quarter, adjusted earnings per share came in at $1.80 versus $2.13 in the year-ago period. Management blamed supply chain disruptions and difficult year-over-year comparisons, but while execution may be playing a part in the disappointing performance, the weakness relative to P&G raises some red flags.
Kimberly-Clark also reduced its outlook for 2021. According to the press release, “the company is now targeting full-year 2021 organic sales growth of 0 to 1 percent and adjusted earnings per share of $7.30 to $7.55. The prior outlook was for organic sales growth of 1 to 2 percent and adjusted earnings per share of $7.75 to $8.00. The updated earnings outlook reflects significantly higher input cost inflation and lower sales volumes, partially offset by higher net selling prices and additional cost savings.”
Both P&G and Kimberly-Clark have strong economic moats, and we would expect them to perform well in the face of rising commodity costs and a heightened inflationary environment. However, Kimberly-Clark’s performance is more suspect than P&G’s and the market has certainly caught on as evidenced by the underperformance of Kimberly-Clark relative to a basket of consumer staples equities. Kimberly-Clark has some work to do to get things back on track.
Concluding Thoughts
Procter & Gamble’s shares have been on an incredible run the past couple years, with the company driving strong organic revenue and earnings per share growth. Kimberly-Clark, on the other hand, has been executing poorly in a market environment where one might think it should be excelling.
Both of these stocks are dividend growth giants, with P&G boasting a 65-year dividend growth track record and Kimberly-Clark stringing together 49 consecutive annual dividend increases. Both also have strong Dividend Cushion ratios of 1.8 at this time, suggesting resilient dividend coverage on a go-forward basis.
That said, investors will have to pay up for P&G’s dividend strength and operational tailwinds, as shares are a bit pricey based on our fair value estimate range, and even Kimberly-Clark’s valuation is only slightly more reasonable after its sharp drop following the 2021 earnings guidance cut.
We expect to make a few tweaks to our valuation models following their respective calendar first-quarter 2021 reports, but if we had to pick between these two dividend growth behemoths, P&G looks like the better relative play. Shares of P&G yield ~2.6%, while shares of Kimberly-Clark yield 3.3%.
Downloads
P&G’s 16-page Stock Report (pdf) >>
P&G’s Dividend Report (pdf) >>
Kimberly-Clark’s 16-page Stock Report (pdf) >>
Kimberly-Clark’s Dividend Report (pdf) >>
—–
Tickerized for VDC, PG, KMB, CL, CLX, CHD
Valuentum members have access to our 16-page stock reports, Valuentum Buying Index ratings, Dividend Cushion ratios, fair value estimates and ranges, dividend reports and more. Not a member? Subscribe today. The first 14 days are free.
Brian Nelson owns shares in SPY, SCHG, QQQ, DIA, VOT, and IWM. Brian Nelson’s household owns shares in HON, DIS, HAS. Some of the other securities written about in this article may be included in Valuentum’s simulated newsletter portfolios. Contact Valuentum for more information about its editorial policies.