
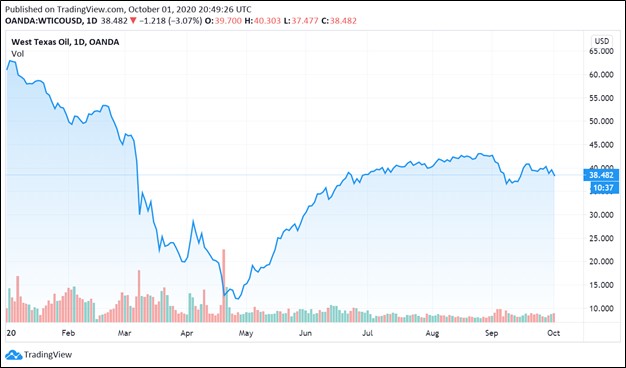
Image Shown: Crude oil prices, measured by the WTI benchmark, plummeted during the initial phases of the COVID-19 pandemic and have yet to fully recover. Declines in global crude oil prices have depressed prices for natural gas, natural gas liquids, and liquified natural gas as well. We expect that it will take some time for the oil and gas industry to truly recover, and hefty net debt loads combined with onerous dividend obligations are making that a very tough task. Juicy dividend yields are a sign of the headwinds facing the oil and gas industry and are not a sign of strong underlying strength in those firms that are paying out generous dividends.
By Callum Turcan
Raw energy resources prices remain very subdued as the ongoing coronavirus (‘COVID-19’) pandemic has simply decimated global energy demand. With airline travel at just a fraction of its pre-pandemic levels, demand for jet fuel (kerosene) has cratered. That is on top of the sharp reductions in gasoline demand as workers stayed home instead of commuting, though gasoline demand has begun to stage a meaningful recovery as lockdown measures were slowly eased worldwide (however, that recovery is on shaky ground). Should quarantine measures get reimposed in key nations worldwide (there is a very real chance that this will be the case), that would weigh negatively on demand for raw energy resources.
Please note that liquified natural gas (‘LNG’) prices on both a spot basis and LNG sold under long-term contracts are often linked to global crude pricing benchmarks, meaning LNG exporting operations are facing significant headwinds as well. Regional natural gas prices are also subdued for this reason. Prices for natural gas liquids (‘NGLs’) like propane and butane are contending with significant headwinds as well, though low oil and natural gas/LNG prices are more significant as it concerns the financial performance of companies operating in this space.
LNG prices in East Asia, for example, are currently fetching around ~$3.50-$4.00 per million British thermal units. From 2010-2014 (before the downturn in raw energy resources prices that started in late-2014), LNG prices were fetching 2x-3x that price. Pain is widespread, and diversification in the realm of raw energy resources extraction has not offset exogenous headwinds for the oil majors that have grown their natural gas and LNG business in recent years (which we will cover later).
Background
Facing immense demand destruction due to COVID-19, the OPEC+ oil cartel reached a deal in April 2020 to curtail a significant amount of oil production from major exporters all around the world with Russia, Saudi Arabia, Kuwait, and the UAE expected to do a lot of the heavy lifting in terms of voluntary cuts. However, that agreement has only put a rough floor below global oil prices and has not led to a significant recovery in crude oil pricing. For reference, WTI (US oil pricing benchmark) and Brent (international oil pricing benchmark) were fetching $60+ a barrel before the pandemic hit, and now are fighting to stay above $40 per barrel as of this writing.
Through the end of 2020, the OPEC+ group agreed to reduce their collective oil output by ~8 million barrels per day (down from ~10 million barrels per day in May and June when demand destruction was at its worst), which will then step down to a ~6 million barrel per day cut starting in January 2021 and that reduction is expected to run through April 2022. Here, we will stress that should OPEC+ stay the course, the outlook for the oil and gas industry would improve considerably, though staying the course and maintaining high levels of compliance is no easy task.
During the initial months of the agreement, numerous nations including Iraq, Nigeria, and Angola (all OPEC member nations) and Kazakhstan (part of the OPEC+ group but not an OPEC member) were nowhere close to being in full compliance. Going forward, core OPEC+ members have been working tirelessly to bring those nations into compliance. Though those aforementioned nations and others have touted that they will start curtailing their production aggressively going forward, achieving full compliance is no easy task. Iraq’s compliance has been improving of late as it promised deeper cuts in August and September to make up for weak compliance in May-July.
Significant production declines in non-OPEC nations that are not a part of the OPEC+ group, including the US, are lending a helping hand in terms of better matching supply with demand. This is a form of “involuntary” production declines, which really means that market forces are at work as compared to a coordinated effort to reduce output to prop up prices.
By late-September, US oil production had fallen to ~10.7 million barrels per day, a sharp drop from ~13 million barrels per day as of February-March. Raw energy resources produced via “fracking,” made possible through a combination of horizontal drilling and hydraulic fracturing techniques, brings wells online with steep production declines. During the first year of production, these “fracked” wells (also referred to as horizontal wells) can post output declines ranging from 45% all the way up to 80% (relative to peak output reached during the first month of production), depending on the play and the type of choke management system used (among other things). That is primarily why US oil production shifted significantly lower in a relatively short period of time.
Oil Majors
Demand destruction for raw energy resources combined with voluntary and involuntary output declines and low raw energy resources pricing wreaked havoc on the upstream divisions of all oil majors. For reference, upstream operations involve the extraction of oil, natural gas, and NGLs from the ground. Additionally, though these firms possess large downstream (refining operations) and petrochemical businesses, their upstream businesses are the source of a large chunk of their cash flows.
When Exxon Mobil Corporation (XOM) reported second quarter 2020 earnings, its upstream division swung from a segment-level profit of $3.3 billion in the same period the prior year to a segment-level loss of $1.7 billion. The company’s downstream and petrochemical business segments performed better, but the upstream pain severely stressed its ability to generate free cash flows. Exxon Mobil issued an update concerning its third quarter performance on October 1 that indicated its financial performance last quarter remained weak.
Though Exxon Mobil’s upstream performance will likely improve going forward given the recovery in US oil prices (which briefly turned negative in the second quarter) and recovery in global raw energy resources prices more broadly over the past few months, the company’s near-term outlook is bleak. During the first half of 2020, Exxon Mobil generated $4.1 billion in NEGATIVE free cash flow while spending $7.4 billion covering its dividend obligations to its shareholders (along with an additional $0.1 billion paid out in dividends to noncontrolling interests).
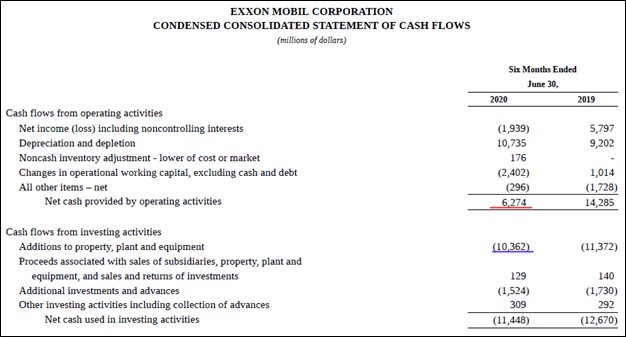
Image Shown: Exxon Mobil generated negative free cash flow during the first half of 2020. Its net operating cash flows are underlined in red and its capital expenditures are underlined in blue. Image Source: Exxon Mobil – 10-Q SEC filing covering the second quarter of 2020
Furthermore, Exxon Mobil exited June 2020 with a $56.9 billion net debt position (inclusive of short-term debt). We are not fond of Exxon Mobil’s dividend coverage strength and that will be reflected when we update the firm’s cash flow models.
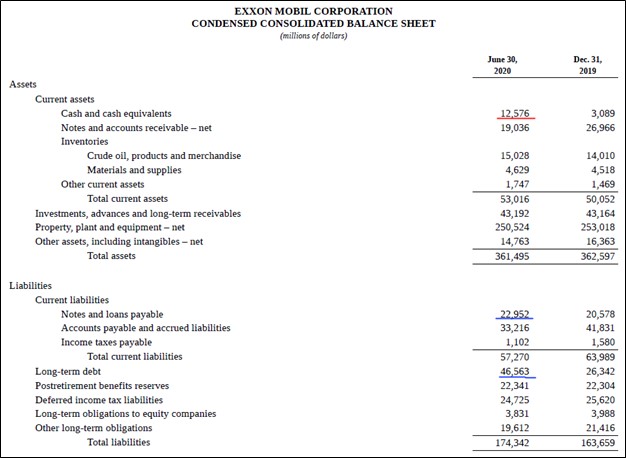
Image Shown: Exxon Mobil carries an enormous net debt position. Its cash and cash equivalents are underlined in red while its short-term and long-term debt loads are underlined in blue. Image Source: Exxon Mobil – 10-Q SEC filing covering the second quarter of 2020
As we mentioned previously, some oil majors attempted to pivot away from crude oil and towards natural gas (including LNG). Royal Dutch Shell plc (RDS.A) (RDS.B) completed its acquisition of BG Group for ~$70 billion back in 2016 through a cash-and-stock deal which saw Shell become a giant in the LNG industry. Considering that global LNG prices have moved significantly lower over the past few years and that this deal bloated Shell’s balance sheet, Shell was forced to cut its dividend in April 2020. That big announcement also noted that the firm suspended its share repurchasing program to conserve cash.
Shell’s adjusted segment-level earnings from its ‘Integrated Gas’ division dropped ~79% year-over-year in the second quarter of 2020, hitting $0.4 billion. During this period, Shell’s upstream division saw its segment-level earnings shift from a profit of $1.3 billion in the second quarter of 2019 to a loss of $1.5 billion in the second quarter of 2020. This pain was only somewhat offset by Shell’s other operations and indicated why the firm had little choice but cut its payout. Shell exited June 2020 with a net debt position of $77.1 billion (inclusive of short-term debt).
BP plc (BP) also cut its dividend recently due to pressures facing its ability to generate cash flows while also managing a large net debt position. Please note we were fortunate enough to remove shares of BP from our High Yield Dividend Newsletter portfolio before the payout cut took place.
ConocoPhillips (COP), often referred to as a “Super-Independent” because the firm spun-off its midstream (energy infrastructure) and downstream segments several years ago, cut its dividend back in 2016 when it was contending with the raw energy resources pricing crash of late-2014 to 2017. At the time, many noted that had ConocoPhillips kept its downstream segment, it would have potentially been able to avoid a payout cut due to downstream operations usually acting as a “natural hedge” against declining raw energy resources prices (due to downstream operations experiencing margin expansion during periods when input prices are falling, at least in theory). However, it appears that the pandemic has proven that fluctuations in raw energy resources prices are simply too powerful to offset, no matter how large or “diversified” the energy giant in question is.
Concluding Thoughts
Most of the juicy dividend yields within the energy space are a sign of the stress facing those companies and the industry at-large, and we caution that the chance other oil majors follow Shell and BP in cutting their payout remains very likely. For instance, Exxon Mobil’s payout is simply not well-covered in the current raw energy resources pricing environment and the firm is taking on a lot of debt to cover those obligations. Chevron Corporation’s (CVX) payout is also on shaky ground as it generated negative free cash flows during the first half of 2020 while carrying a large net debt load at the end of June, though like Exxon Mobil, Chevron’s management team has stuck with its current dividend policy so far. Like Shell, Chevron also grew its natural gas and LNG business meaningfully over the past few years, but that strategy did not pan out as intended.
While we expect the outlook for the oil and gas industry will improve over time as global demand for raw energy resources rebounds as lockdown measures ease, that is off an exceptionally low base. The dividend policies of most oil majors were created during a time when global oil prices were trading in the $80-$110 per barrel range. Now that WTI and Brent are fighting to stay over $40 per barrel, the industry will need to adjust accordingly. A sustained recovery in raw energy resources pricing remains a ways off, and as oil prices rise, it will become harder for OPEC+ to maintain high compliance rates as nations are encouraged to boost output to help cover their national finances.
We prefer companies operating in other industries and sectors and expect to see additional dividend cuts going forward. The oil and gas industry is simply not a good source of income generating opportunities in the current environment.
—–
Oil & Gas (Majors Industry) – BP CVX COP XOM RDS.A RDS.B TOT
Independent Oil & Gas Industry – APA COG CLR DVN EOG MRO OXY PXD
Industrial Minerals – ARLP, CCJ, CNX, HCR, NRP
Refining Industry – HES HFC MPC PSX VLO
Oil & Gas Pipeline Industry – ENB ET EPD KMI MMP
Energy Equipment & Services (Large) Industry – BKR HAL NBR NOV SLB FTI SI
Related: XLE, XOP, BNO, USO, UNG
—–
Valuentum members have access to our 16-page stock reports, Valuentum Buying Index ratings, Dividend Cushion ratios, fair value estimates and ranges, dividend reports and more. Not a member? Subscribe today. The first 14 days are free.
Callum Turcan does not own shares in any of the securities mentioned above. Enterprise Products Partners L.P. (EPD) and Magellan Midstream Partners L.P. (MMP) are both included in Valuentum’s simulated High Yield Dividend Newsletter portfolio. Some of the other companies written about in this article may be included in Valuentum’s simulated newsletter portfolios. Contact Valuentum for more information about its editorial policies.