
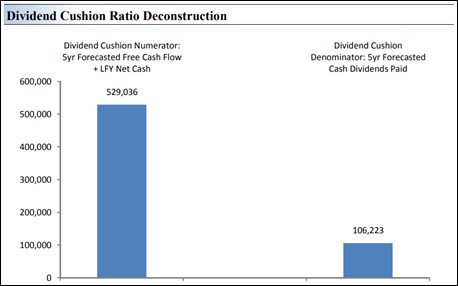
Image Shown: Valuentum’s Dividend Report on Microsoft. The Dividend Cushion Ratio Deconstruction reveals the numerator and denominator of the Dividend Cushion ratio for Microsoft. At the core, the larger the numerator, or the healthier a company’s balance sheet and future free cash flow generation, relative to the denominator, or a company’s cash dividend obligations, the more durable the dividend. In the context of the Dividend Cushion ratio, Microsoft’s numerator is larger than its denominator suggesting strong dividend coverage in the future. The Dividend Cushion Ratio Deconstruction image puts sources of free cash in the context of financial obligations next to expected cash dividend payments over the next 5 years on a side-by-side comparison. Because the Dividend Cushion ratio and many of its components are forward-looking, our dividend evaluation may change upon subsequent updates as future forecasts are altered to reflect new information.
By Brian Nelson, CFA
The enterprise valuation model, also known as the discounted cash-flow (DCF) model, is one of the most powerful tools for the investor and financial advisor (read more about this in Value Trap). The applications of this product seem to be never-ending. You may be aware of how the DCF is used to calculate the fair value estimate, reverse engineer the market’s assumptions by setting the model to the share price, and function as a part of a multi-faceted process such as the Valuentum Buying Index (VBI) rating. But did you know that the DCF is also integral to our dividend growth analysis?
At Valuentum, we publish Dividend Cushion ratios on hundreds of stocks (view their Dividend Reports). The Dividend Cushion ratio is a vast improvement over the dividend payout ratio, which primarily uses accounting data. For example, where the dividend payout ratio expresses the health of a dividend as a function of dividends-per-share divided by earnings-per-share, the Dividend Cushion ratio focuses intensely on the cash-based sources of intrinsic value that also are used to fund the dividend. Dividends will always be paid from cash on the balance sheet, not from accounting earnings.
The Dividend Cushion ratio considers the forecasts we make for future expected free cash flows over the next five years, as modeled within the DCF construct that drives the fair value estimate of the company and sums up these free cash flows. Next, this free-cash-flow sum is added to the net cash position on the company’s balance sheet, as of its last fiscal year, to arrive at our opinion of the company’s total cash funding capacity for dividends, buybacks, and acquisitions. For the unadjusted Dividend Cushion ratio, the process of adding the next five years’ worth of free cash flow to a company’s net cash position represents the numerator.
Because the dividend is often considered “sacred” for many companies (meaning that management teams don’t take it lightly when they announce a dividend cut) and because buybacks and acquisitions are often considered more discretionary in nature, we do not deduct buybacks and acquisitions from that total estimated cash funding capacity, or the numerator, over the next five years. This perspective within the analysis allows us to account for the optionality that any executive team has with respect to preserving the dividend payout in the event they choose to scale back repurchases or put deal-making on hold in the coming years.
There are also a few logical reasons for this. For one, it’s good practice not to build in material buybacks or unannounced acquisitions. If we were to do so with buybacks, we’d have to know the share price at the time of the buybacks in the future, and if we knew this information, then we wouldn’t need to have a risk-management model at all because we’d know future prices, which nobody can possibly know. The same line of logic follows with unannounced acquisitions. If we knew which deals the company would make, well then, we’d be privy to inside information, which is a no-no.
The denominator of the Dividend Cushion is simple. We add our expectations for cash dividends paid over the next five years, again within the construct of the DCF. In the case of the denominator, we build in future forecasts, much like an analyst may build in future forecasts for earnings per share. Because the future is inherently unpredictable, at least to varying degrees, our forecasts for dividend per-share growth may be spot on at times–or sometimes they may be off the mark, but not unlike what you may see with respect to EPS beats and misses on the Street. The construct of the Dividend Cushion ratio, however, isn’t too dependent on precision, especially given the flexibility many management teams have over a future five-year period.
Let’s have a look at the Dividend Cushion ratio of one of our favorite dividend growth stocks, Microsoft (MSFT). As shown in the image at the top of this article, Microsoft’s numerator of the Dividend Cushion ratio is ~$529 billion, far in excess of its denominator, which stands at ~$106 billion, a measure that also includes fairly aggressive dividend per-share growth in the payout. Needless to say, Microsoft’s dividend payout is very, very healthy, perhaps as healthy as it gets for many companies. We wouldn’t be surprised if Microsoft becomes one of the greatest dividend growth stocks in the coming decades.
During the past 10 years or so, we’ve been mighty impressed with the performance and construct of the Dividend Cushion ratio. Though the Dividend Cushion ratio was not perfect during the COVID-19 meltdown, where future free-cash-flow expectations changed in an instant, some 60+ equity REITs and 30+ mortgage REITs, perhaps even more, slashed their payouts during the swoon in 2020. We have warned fervently on the capital-market dependence risk of these entities, and our prescient work on MLPs before their collapse in 2015 and 2016 has only supported this view. Without continued access to the capital markets at favorable rates, many entities must rely on the internally generated cash-based sources of intrinsic value that are the absolute core of the Dividend Cushion ratio.
As with the VBI rating, the Dividend Cushion ratio is not to be followed blindly. For one, even a company with a high Dividend Cushion ratio may cut its payout, particularly if management makes a poor acquisition, or as in the case of COVID-19, the management team just wants to be a bit more conservative with cash management (before reinstating the payout). A company with a low Dividend Cushion ratio isn’t guaranteed to cut its payout either. Many companies have a lot of levers to pull from selling non-core assets to issuing equity, among other considerations, to keep laboring on.
The Dividend Cushion ratio should be viewed as a ranking of financial risk to the payout. A company with a high Dividend Cushion ratio has a lower risk of a dividend cut than a company with a lower Dividend Cushion ratio, much like a company with an elevated credit rating has a lower risk of defaulting on its debt relative to a company with a weak credit rating. We witnessed during the Great Financial Crisis how some companies with high credit ratings can default (e.g. Lehman Brothers), and many companies with weak credits such as Netflix (NFLX) can thrive, but the ranking mechanism is nonetheless very useful.
For many high dividend-yielding equities, investors won’t be able to find many with high Dividend Cushion ratios, and this is because these companies tend to have outsized future dividend obligations and often hefty net debt positions, the former increasing the denominator and the latter reducing the numerator. Many high dividend-yielding equities also come with lower earnings multiples as net debt is a subtraction to enterprise value in arriving at an estimate of equity value before dividing by weighted average shares outstanding and then by earnings per share. Many times, the high dividend yield is often a sign of increased risk, not increased opportunity.
We estimate the efficacy of the Dividend Cushion ratio in warning against dividend cuts at about 90%. We measure this efficacy by looking at the Dividend Cushion ratios of companies that have cut their payouts in our coverage. If the company had a Dividend Cushion ratio below 1, we’d view the Dividend Cushion ratio as doing its job. Not all companies with high Dividend Cushion ratios are insulated from dividend cuts, and not all companies with low Dividend Cushion ratios will cut their dividend, but the Dividend Cushion ratio is yet another Valuentum-driven tool for your investor tool kit.
Enjoy!
Efficacy of the Dividend Cushion Ratio >>
—-
Tickerized for holdings in the SPYD.

—–

Image Source: Value Trap
———-
Valuentum members have access to our 16-page stock reports, Valuentum Buying Index ratings, Dividend Cushion ratios, fair value estimates and ranges, dividend reports and more. Not a member? Subscribe today. The first 14 days are free.
Brian Nelson owns shares in SPY, SCHG, QQQ, DIA, VOT, and IWM. Brian Nelson’s household owns shares in HON, DIS, HAS. Valuentum owns shares in VOO, SCHG, DIA, and QQQ. Some of the other securities written about in this article may be included in Valuentum’s simulated newsletter portfolios. Contact Valuentum for more information about its editorial policies.