

Image Source: Newmont Corporation – First Quarter of 2020 Earnings IR Presentation
By Callum Turcan
On May 5, the gold miner Newmont Corporation (NEM) reported first quarter 2020 earnings that missed both consensus top- and bottom-line estimates which prompted shares to sell off modestly during the normal trading session that day, though shares of NEM have been on an epic bull run since the start of 2020. We continue to like Newmont as an idea in our Dividend Growth Newsletter portfolio with shares of NEM up ~48% as of this writing since joining the portfolio on January 13, 2020 (link here), before taking dividend considerations into account, while the S&P 500 (SPY) is down ~13% during this period before taking dividend considerations into account. At Newmont’s new annualized dividend payout of $1.00 per share, shares of NEM yield ~1.6% as of this writing.
Due to unprecedented monetary and fiscal stimulus measures enacted to combat the negative economic impact created by the ongoing coronavirus (‘COVID-19’) pandemic, gold prices (GLD) have performed very well so far this year. COMEX gold prices for July 2020 deliveries are trading near $1,700 per troy ounce as of this writing, up from ~$1,500-$1,550 at the start of 2020 and ~$1,200-$1,300 one year ago. Newmont is a very high-quality gold miner that expects to maintain a stable gold production base over the coming years after acquiring Goldcorp and merging its Nevada gold mining operations with Barrick Gold Corporation (GOLD) last year.
As it relates to the synergies from the Goldcorp deal, those are coming in stronger than expected versus its initial target for $365 million in run-rate synergies by the end of 2021 (now estimated at $500 million) as you can see in the upcoming graphic down below. Going forward, synergies from the Nevada joint-venture with Barrick could further enhance Newmont’s cost structure and thus its cash flow profile (at any gold price), which we really appreciate.

Image Shown: An overview of Newmont’s recent financial news and synergies target. Image Source: Newmont – First Quarter of 2020 Earnings IR Presentation
Financials
Newmont exited the first quarter of 2020 with $3.7 billion in cash and cash equivalents versus $0.1 billion in short-term debt and $6.0 billion in long-term debt on hand, providing the firm with ample financial flexibility to ride out the storm. Additionally, Newmont had $0.2 billion in short-term ‘investments’ and $2.9 billion in long-term investments on the books at the end of March 2020, however, some of that represents strategic investments in operations such as the producing Pueblo Viejo Mine (a gold mining operation).

Image Shown: A look at a more detailed overview of Newmont’s short-term and long-term investments line-items, many of which are strategic assets to the company. Image Source: Newmont – 10-Q filing covering the first quarter of 2020
During the first quarter of 2020, Newmont sold its investments in Continental Gold Inc for $0.25 billion in cash proceeds which resulted in the firm recognizing a gain on the sale of $0.1 billion. We appreciate Newmont optimizing its balance sheet and economic interests in potential mining opportunities as that better positions the company for the long haul in terms of operational focus. As it relates to its economic interests in TMC Resources Inc (TMMFF), Newmont recorded an impairment charge of $0.1 billion last quarter as shares of TMMFF had fallen significantly from the end of 2019 to the end of the first quarter of 2020.
Additionally, Newmont completed the divestment of its 50% stake in Kalgoorlie Consolidated Gold Mines in Australia and its sale of the Red Lake complex in Canada last quarter, two moves we covered previously (link here):
Please keep in mind that Newmont closed one significant asset sale at the start of 2020 and is in the process of closing another deal [which has since closed], as covered in this excerpt from its 2019 Annual Report:
In the fourth quarter of 2019, we entered into a binding agreement to sell the Red Lake complex in Ontario, Canada to Evolution Mining Limited [CAHPF] (“Evolution”). Pursuant to the terms of the agreement, upon closing the transaction we will receive proceeds of $375 [million] in cash, adjusted for normal working capital movements, with contingent payments of up to an additional $100 [million] tied to new mineralization discoveries over a fifteen year period.
In the fourth quarter of 2019, we entered into a binding agreement to sell our 50% interest in Kalgoorlie Consolidated Gold Mines (“Kalgoorlie”), included as part of our Australia segment, to Northern Star Resources Limited [NESRF] (“Northern Star”). We completed the sale on January 2, 2020, and pursuant to the terms of the agreement, received proceeds of $800 [million], including $25 [million] that gives Northern Star specified exploration tenements, transitional services support and an option to negotiate exclusively for 120 days the purchase of our Kalgoorlie power business for fair market value.
Combined, these divestments raised ~$1.4 billion in cash last quarter. Newmont’s liquidity position is further supported by its remaining $2.9 billion in borrowing capacity under its $3.0 billion revolving credit line that matures in April 2024. The company is well-positioned to meet its enlarged dividend obligations while staying on top of its debt maturities and other commitments.
In late-March 2020, Newmont closed on the issuance of $1.0 billion in 2.250% Senior Notes due 2030, highlighting its ongoing access to capital markets at very attractive rates. Those proceeds were used for refinancing activities (which included retiring 3.500% Senior Notes due 2022, 3.700% Senior Notes due 2023, and 3.700% Senior Notes due 2023 owed by Newmont’s Goldcorp subsidiary) and Newmont was able to secure a lower coupon on its newly issued debt, which we appreciate. Newmont exited the first quarter of 2020 with a net debt to adjusted EBITDA ratio of 0.7x on a pro forma basis.
In the first quarter of this year, Newmont generated $0.6 billion in free cash flows and spent $0.3 billion repurchasing its stock along with $0.1 billion covering its dividend (paid out at the old quarterly rate of $0.14 per share, which has since been increased to $0.25 per share on a quarterly basis). Newmont’s Dividend Cushion ratio sits at 2.2 allowing for a “GOOD” Dividend Safety rating and we also rate the gold miner’s Dividend Growth outlook as “GOOD” especially with unprecedented monetary and fiscal stimulus programs across the world propping up the price of gold. Here’s what Newmont’s management team had to say during the gold miner’s latest quarterly conference call (emphasis added):
“…[W]e expect to generate substantial free cash flow throughout the gold price cycle. For every $100 increase in gold price above our base assumption, Newmont delivers approximately $400 million of incremental attributable free cash flow per year. Using our conservative $1,200 gold price planning assumption, our free cash flow would still total more than $5 billion over the next five years and at current gold prices our portfolio will generate around $15 billion of free cash flow over the same five-year time frame.
In addition, we have the potential for further upside with tailwinds from favorable oil prices and foreign currency exchange rates. The excess free cash we generate will be used to reduce our net debt and provide additional returns to shareholders. Looking forward, we are well positioned to continue executing our capital priorities and staying focused on creating long term value.” — Tom Palmer, CEO of Newmont
We are very supportive of Newmont’s capital allocation strategies, particularly as it relates to net debt reduction via strong free cash flow generation. The upcoming graphic down below highlight’s how higher gold prices (which are currently trading near ~$1,700 per troy ounce) impacts Newmont’s expected free cash flows over the coming years.
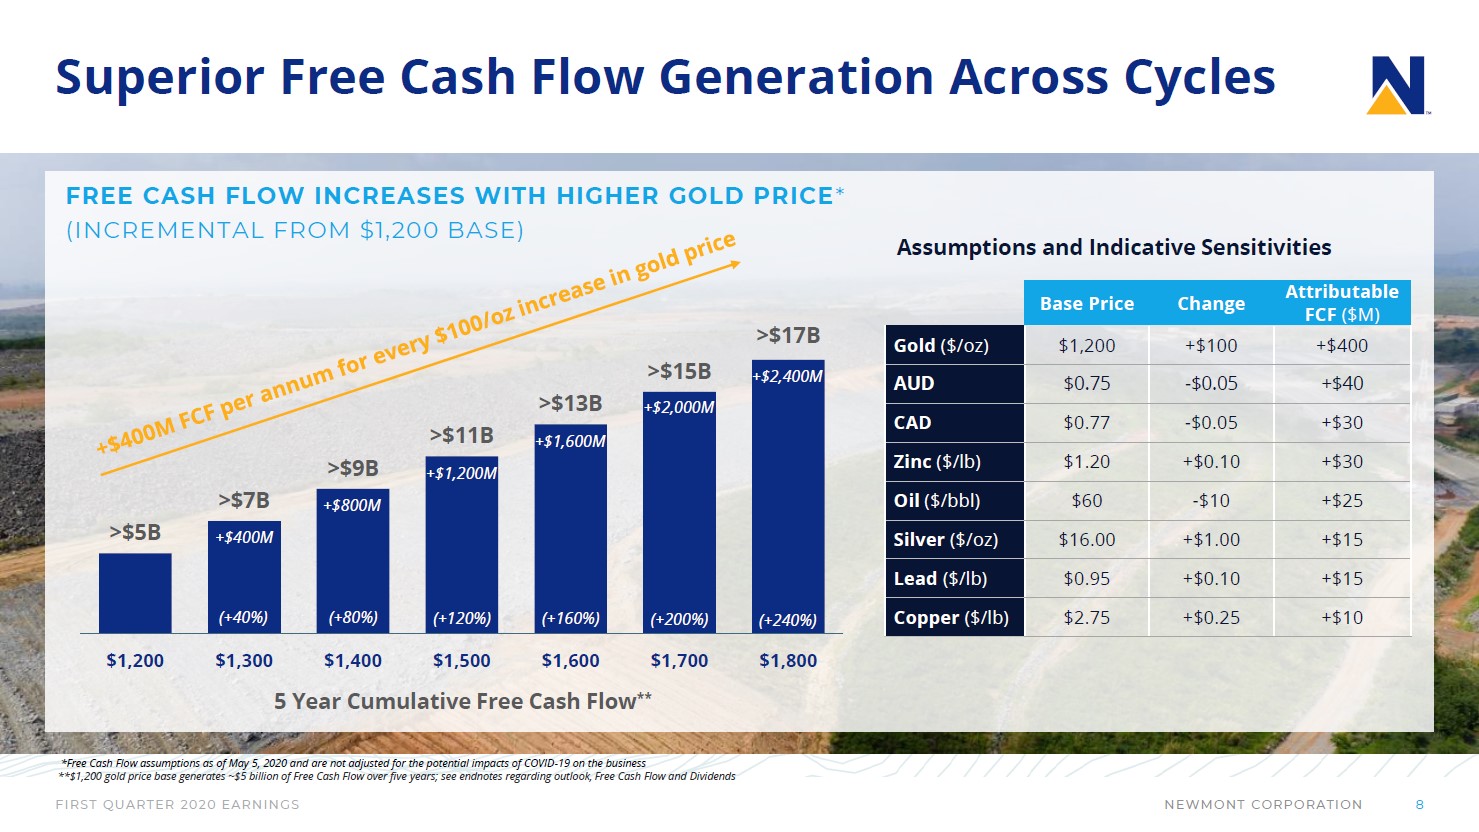
Image Shown: Higher gold prices of late has had a very powerful impact on Newmont’s expected free cash flow generation over the coming years. Image Source: Newmont – First Quarter of 2020 Earnings IR Presentation
Newmont noted during its latest quarterly conference call that it had completed about 80% of its $1.0 billion share buyback program, retiring ~19 million shares at an average price of $42 per share. When asked about its capital allocation priorities, management noted that half of Newmont’s capital allocation (it isn’t clear if management meant as a percentage of net operating cash flows or not) would go towards investing in Newmont’s gold mining business and the other half would go towards dividends, debt reduction, and share buybacks.
Operational Update
The Musselwhite gold mine up in Canada faced operational problems last year as one of the mine’s conveyors caught on fire which in turn led to a power shutdown that forced the pumps that extract water from the mine to go offline. Newmont has been steadily working to repair its operations at Musselwhite; however, the pandemic has pushed back the completion of those repairs according to management. Please note that Newmont had almost completed a $90 million materials handling upgrade at Musselwhite, a project that aims to improve the way ore is moved to the crusher at the mine by constructing a raise bore winze, before shutting down construction on its repair and upgrading activities (we covered this situation before the pandemic started to spread in this article here). Here’s a key quote from management during Newmont’s latest quarterly conference call:
“At Musselwhite, we proactively moved to care and maintenance on March 23 in order to minimize fly-in/fly-out activity to prevent the possible transmission of the virus into communities, including nearby First Nations communities in northern Ontario. We are developing plans to safely and efficiently resume operations…
At Musselwhite, our team was exceeding their commitments and the conveyer installation was approximately 65% complete and well ahead of schedule before we placed the site in care and maintenance in late March. We now have every part for the conveyer installation in Thunder Bay, and installation of the conveyer will be the first thing to ramp up after a decision is made to resume operations. The Musselwhite materials handling project is 95% complete and will be ready for a full system test once the conveyer is installed.” — Rob Atkinson, Newmont’s COO
Additionally, please note that COVID-19 related shutdowns at the Musselwhite mine will marginally put downward pressure on Newmont’s total production capacity. However, the mine was responsible for only a tiny amount of Newmont’s gold production last quarter (about 1%, and please note that operational costs were elevated at this asset due to the need to ramp production back up to achieve meaningful economies of scale, and ongoing repair and upgrade activities). The three other mining operations that were temporarily put on care and maintenance due to the pandemic have all since restarted according to management (from Newmont’s latest quarterly conference call):
“In mid-March, we proactively placed four operations in care and maintenance in order to protect the health of our workforce, neighboring communities, and to comply with government mandated restrictions. Three of these sites – Yanacocha, Cerro Negro and Eleonore, have since resumed operations.” — Newmont’s COO
We really appreciate this operational guidance as it indicates that Newmont should be able to continue capitalize on strong gold prices seen this year by maintaining its gold production base.
Concluding Thoughts
Newmont is a prime way to capitalize on strong gold prices of late and acts as a natural hedge against potential inflationary effects of unprecedented fiscal and monetary measures seen around the globe, including in the US. We continue to like Newmont as a holding in our Dividend Growth Newsletter portfolio and see plenty of room for additional upside ahead.
—–
Diversified Mining Industry – BHP FCX NEM RIO SCCO VALE WPM
Related: GLD, SLV, GOLD, CAHPF, TMMFF, NESRF
Other: GDX, NUGT, IAU, GGN, DUST, SIL, USLV, PPLT, PHYS, AGQ, PALL
—–
Valuentum members have access to our 16-page stock reports, Valuentum Buying Index ratings, Dividend Cushion ratios, fair value estimates and ranges, dividend reports and more. Not a member? Subscribe today. The first 14 days are free.
Callum Turcan does not own shares in any of the securities mentioned above. Newmont Corporation (NEM) is included in Valuentum’s simulated Dividend Growth Newsletter portfolio. Some of the companies written about in this article may be included in Valuentum’s simulated newsletter portfolios. Contact Valuentum for more information about its editorial policies.