ValuentumAd

Official PayPal Seal

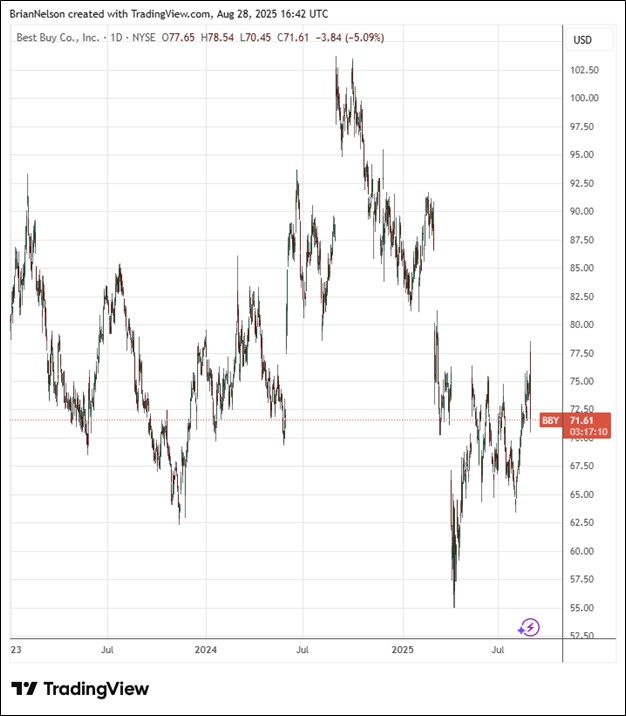
Best Buy Puts Up Best Comp Growth in Three Years

publication date: Aug 28, 2025
View a Printer Friendly version of this page, allowing you to print the page. Send a summary of this page to someone via email.

Image Source: TradingView. 

We liked that Best Buy put up its strongest comparable store sales growth in the past three years, with domestic comparable online sales growth of 5.1%, lapping a decline of 1.6% in last year’s quarter. As a percentage of total domestic revenue, online revenue now accounts for 32.8% versus 31.5% last year. For the six month period ended August 2, cash flow from operations was $783 million, while capital spending was $341 million, resulting in free cash flow of $442 million, higher than its cash dividends paid of $403 million over the same time period. Best Buy covers dividends paid while it boasts a net cash position on the balance sheet. Shares yield 5% at the time of this writing.


Subscribe Now to Gain Access!

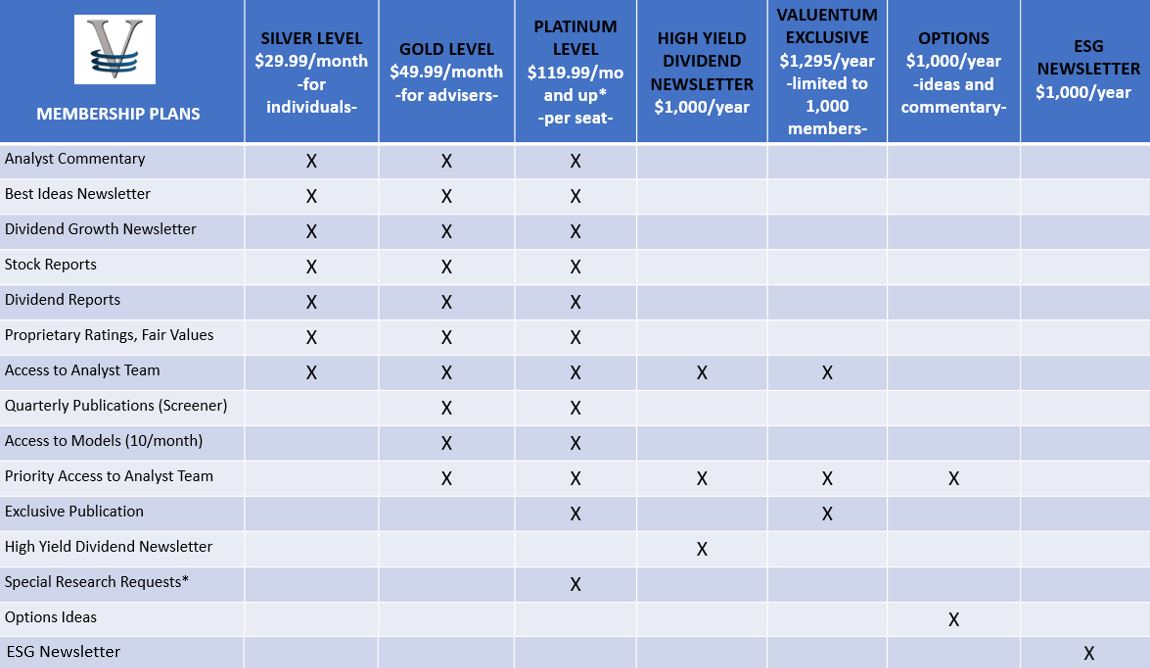
This page is available to subscribers only. To gain access to members only content (including this research piece), click here to subscribe. With a subscription, you'll have access to all of our premium commentary, equity reports, dividend reports and Best Ideas Newsletter and Dividend Growth Newsletter, as well as receive discounts on all of our modeling tools and products. Financial advisers and institutional investors have even more to choose from!

Click to Learn More about Valuentum

If you are already a subscriber, please
login.

If you believe you should be able to view this area then please contact us and we will try to rectify this issue as soon as possible.


To gain access to the members only content, click here to subscribe. You will be given immediate access to premium content on the site.