
We generally like the diversification provided in the Energy Select SPDR ETF (XLE) as one way to consider exposure to the energy resource arena, but let’s get the highlights on some of the most-viewed energy-related ideas on our website: Kinder Morgan, Energy Transfer Partners/Equity, Enterprise Product Partners, Magellan Midstream, and Exxon Mobil.
By Kris Rosemann and Brian Nelson, CFA
An estimate of intrinsic value is as important as a view that shares of a company are undervalued or overvalued, and we think an application of a fair value estimate range is most helpful. The question, “What is a company worth?”, remains paramount to any investment thesis. The fair value estimate is the outcome of any research and analysis. We’d view the company as undervalued across prices on green line and overvalued across prices on the red line.
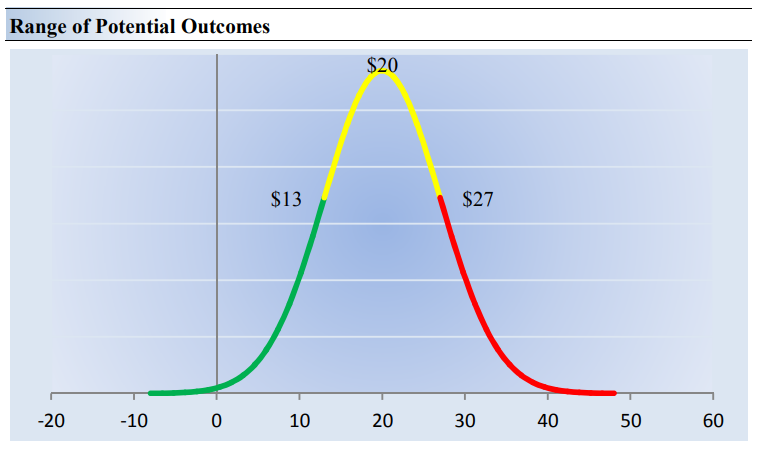
Image Source: Valuentum
Kinder Morgan is one of the largest midstream energy companies in North America, and its operations are conducted through the following business segments: Natural Gas Pipelines (56% of EBDA), CO2, Products Pipelines, Terminals, and Kinder Morgan Canada. We applaud management’s recent efforts to reduce its lofty financial leverage, and it is targeting a net debt-to-adjusted EBITDA ratio of around 4.5x by the end of 2018–assuming it is able to de-lever with the proceeds from the sale of the Trans Mountain Pipeline–while funding all investment needs with internally-generated free cash flow in 2018.
Through the first six months of 2018, Kinder Morgan has generated cash flow from operations of $2.47 billion with total capital spending of $1.47 billion, good enough for roughly $1 billion in free cash flow generation. This is fantastic. The measure is also far in excess of its cash dividends paid on common shares of $719 million over the same time period. Kinder Morgan’s dividend is now in excellent shape, after cutting it in late 2015.
Furthermore, Kinder Morgan expects to be considered for a credit ratings upgrade in the near future, though investors should note that it has debt maturities of $2.18+ billion each year from 2019-2022 ($2.8 billion in 2019, $2.18 billion in 2020, $2.4 billion in 2021, and $2.45 billion in 2022), all of which we expect it to be able to roll over easily given its strong free cash flow generation. Things are moving in the right direction at Kinder Morgan, and we like what we see.
We currently value shares at $20 each, but the high end of our fair value estimate is $27 (and we would not be surprised to see a bounce in shares). Kinder Morgan’s adjusted Dividend Cushion ratio sits at parity (1), mostly because of its large net debt position. We think the company will be successful delivering on its 25% dividend growth in 2019 and 2020 ($1.00 in 2019 and $1.25 in 2020). Our expectations for Kinder Morgan’s dividend growth are provided below.
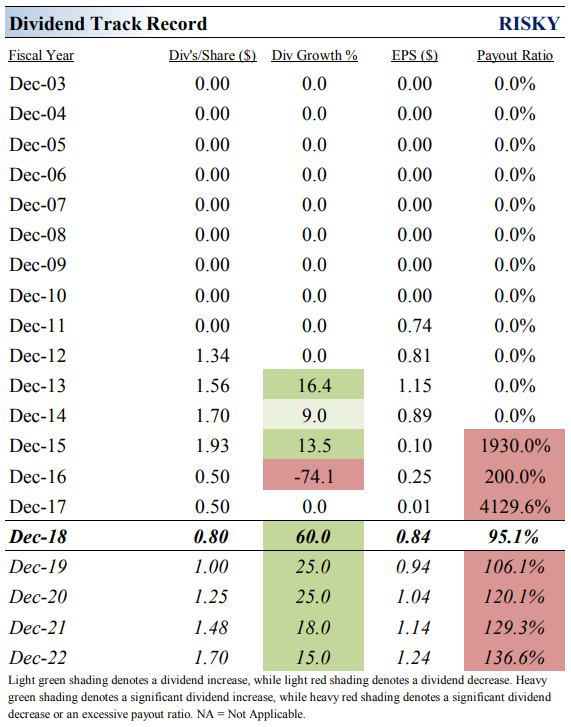
Image Source: Valuentum
Note: An MLP’s adjusted Dividend Cushion ratio gives it credit for continued access to the capital markets and may not be the most appropriate estimate of risk in the payout if such access becomes challenged.
Energy Transfer Partners (ETP) – Fair Value Estimate: $23 per share
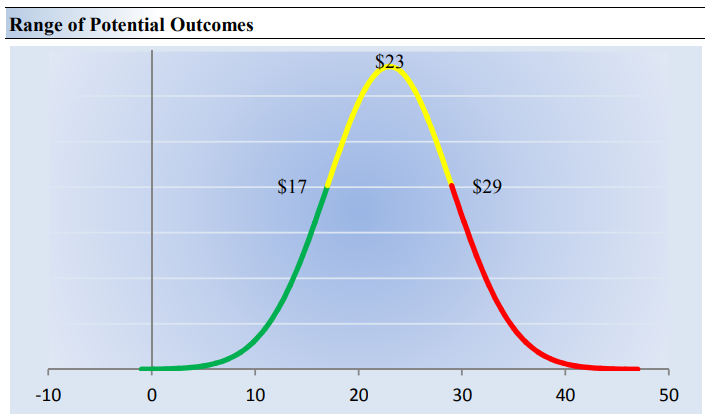
Image Source: Valuentum
On August 1, Energy Transfer Equity announced that it would roll up Energy Transfer Partners in a unit-for-unit merger exchange. Energy Transfer Equity’s incentive distribution rights (IDRs) in Energy Transfer Partners will be eliminated, and the deal is scheduled to close in the fourth quarter of 2018. The executive team expects to maintain the ETE distribution per unit, but we note that such a distribution remains a function of the availability of outside capital from the debt and equity markets. The company expects to fund the majority of growth capital spending with retained cash flow, but while this may sound great on the surface, it also implies that the combined entity still cannot fund both the distribution and maintenance/growth capital spending with operating cash flow.
Here’s what we mean. During the first six months of 2018, for example, Energy Transfer Equity generated $3.16 billion in cash flow from operations, but it spent $3.54 billion in capital spending, revealing negative free cash flow during the period. The company still paid out $1.79 billion in distributions to non-controlling interests and another $532 million in distributions to partners, despite the free cash flow shortfall. We continue to believe that internal operating cash flow is the lowest cost form of internal funding, and therefore, applied to the highest-return growth projects, meaning that in aggregate, the distribution is being financed in part by external market activity and/or asset sales (i.e. inorganic measures) because free cash flow is negative.
Furthermore, in many MLP rollups that we have witnessed of late, there have been implied distribution cuts in the combined entity, and this looks to be the case at ETE-ETP. By scooping up Energy Transfer Partners units, it swaps a $2.26 per unit distribution obligation for a $1.22 dividend obligation at Energy Transfer Equity, while Energy Transfer Partners’ unitholders only receive 28% more units. By our back-of-the-envelope math, that means the dividend/distribution equivalent of the swap for Energy Transfer Partners unitholders is a reduction from the $2.26 distribution to a $1.56 dividend ($1.22 x 1.28). Income investors can’t be too pleased by this. Our fair value estimate for Energy Transfer Partners is $23 per share.–
Note: An MLP’s adjusted Dividend Cushion ratio gives it credit for continued access to the capital markets and may not be the most appropriate estimate of risk in the payout if such access becomes challenged.
Enterprise Products Partners (EPD) – Fair Value Estimate: $28 per share

Image Source: Valuentum
Enterprise Product Partners boasts one of the most integrated midstream energy systems in the US, with pipelines connecting to more than 90% of refining capacity east of the Rockies. This integrated system allows the MLP to reduce the impact commodity price swings have on its business, and we like its simplified ownership structure that has no general partner incentive distribution rights, allowing for long-term durability and flexibility. The entity continues to invest billions in new natural gas, NGLs and crude oil infrastructure, including in the Eagle Ford, Rockies, and Permian Basin, and it expects to play a meaningful role in the US’ continued growth as the largest exporter of liquefied petroleum gas (LPG).
Management has set a goal of self-funding growth capital spending through 2019, a target of which we are quite fond. However, it is important to note that free cash flow ($777 million = $2.7 billion less $1.92 billion) still did not cover cash distributions paid ($1.85 billion) during the first six months of 2018, per its most recent 10-Q. The MLP has raised its distribution for 56 consecutive quarters as of the second quarter of 2018, and its adjusted Dividend Cushion ratio currently sits at 1.9. Our current fair value estimate for Enterprise Product Partners is $28 per unit, about in line with where shares are currently trading.
Note: An MLP’s adjusted Dividend Cushion ratio gives it credit for continued access to the capital markets and may not be the most appropriate estimate of risk in the payout if such access becomes challenged.
Magellan Midstream (MMP) – Fair Value Estimate: $69 per share
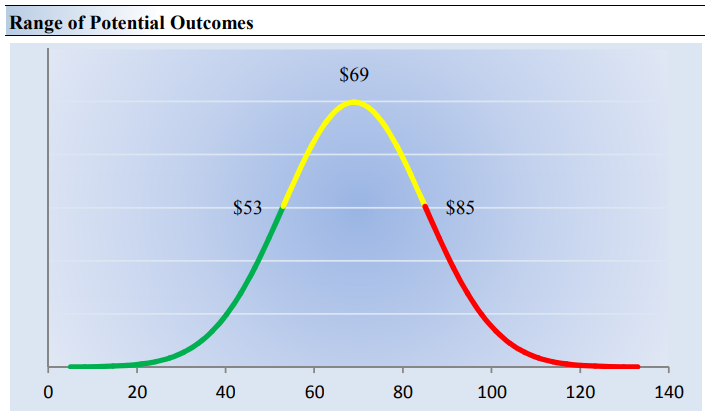
Image Source: Valuentum
Magellan Midstream Partners is an MLP that holds investment grade credit ratings (BBB+/Baa1) with no incentive distribution rights, the latter of which provides the MLP with a more simple organizational structure and a relatively lower cost of capital relative to peers. It has a history of maintaining sector-leading credit metrics, and it continues to target a leverage ratio (consolidated debt-to-EBITDA) of less than or equal to 4x.
Magellan boasts the longest refined products pipeline system in the US, primarily transporting gasoline and diesel fuel (refined products account for ~55% of its operating margin), and the breadth of its system (it can access nearly 50% of US refining capacity) gives it competitive advantages and a stable business model. Management expects fee-based, low risk operations to account for 85%+ of its operating margin, and the MLP is targeting 5%-8% distribution growth in 2019 and 2020 on top of 8% growth in 2018.
We currently value units at $69 each, and its adjusted Dividend Cushion ratio sits at 1.2. During the first six months of 2018, Magellan generated operating cash flow of $564.1 million and spent $219.4 million in capital spending, good enough for ~$344.7 million in free cash flow. Though this falls short of the $423.9 million in distributions paid over the same time period, Magellan is one of the better free cash flow generators within the midstream space.
Note: An MLP’s adjusted Dividend Cushion ratio gives it credit for continued access to the capital markets and may not be the most appropriate estimate of risk in the payout if such access becomes challenged.
Exxon Mobil (XOM) – Fair Value Estimate: $83 per share
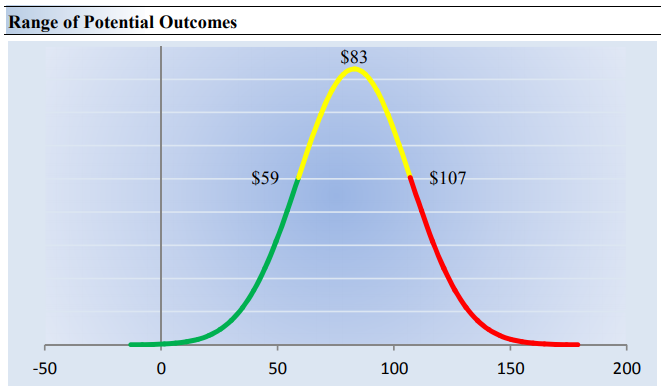
Image Source: Valuentum
Though Exxon Mobil lost its pristine AAA credit rating, its financial health is still solid, and it held more than 21 BOEB of total proved reserves at the end of 2017. Management believes its current upstream next-generation assets represent is strongest portfolio of opportunities since the merger of Exxon and Mobil around the turn of the century, while the shifting of its downstream operations, in which it is heavily investing, to higher-value products is expected to improve profitability. It estimates proprietary technology will help downstream margins expand by 20%, which will only benefit from the company’s expectations for global energy demand to rise by ~25% through 2040.
Exxon is competitively positioned across the value chain, which helps mitigate sector risk and adds flexibility to capture new opportunities. Its integrated operations add synergy and optionality potential while maximizing value in dynamic markets. The firm estimates that cash flow from operations could nearly double by 2025 assuming 2017 prices hold. 2018 marked the 36th consecutive year in which the company has raised its annual dividend, and its Dividend Cushion ratio currently sits at 1.2. We value shares at $83 each, and the company yields ~4%. Our forecasts for Exxon Mobil’s dividend growth are provided in the image below, and the company remains one of our favorite ideas in the energy space.
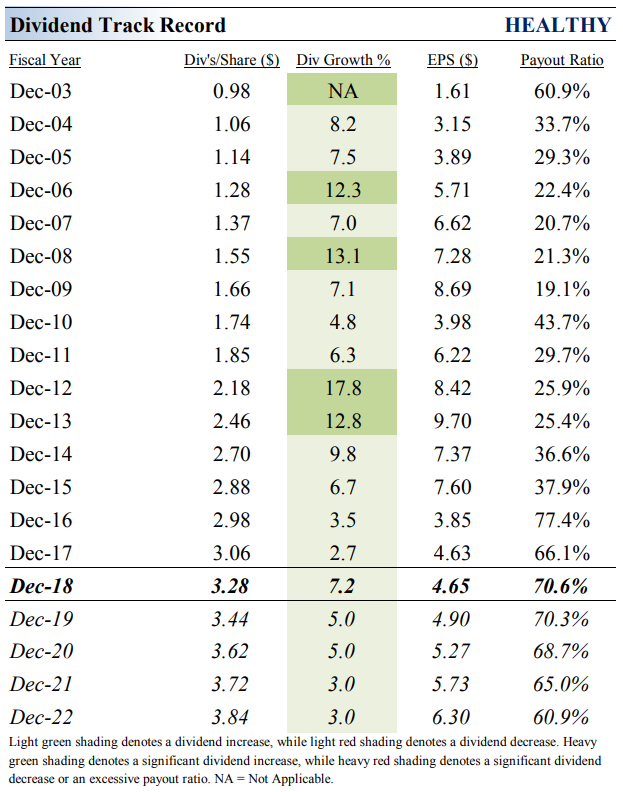
Image Source: Valuentum
Oil & Gas – Major: BP, COP, CVX, RDS, TOT, XOM
—–
Valuentum members have access to our 16-page stock reports, Valuentum Buying Index ratings, Dividend Cushion ratios, fair value estimates and ranges, dividend reports and more. Not a member? Subscribe today. The first 14 days are free.
Kris Rosemann and Brian Nelson do not own shares in any of the securities mentioned above. Some of the companies written about in this article may be included in Valuentum’s simulated newsletter portfolios. Contact Valuentum for more information about its editorial policies.