Member LoginDividend CushionValue Trap
|
The Dividend Cushion Ratio Was Ahead of Tupperware’s Cut
publication date: Feb 4, 2019
|
author/source: Kris Rosemann
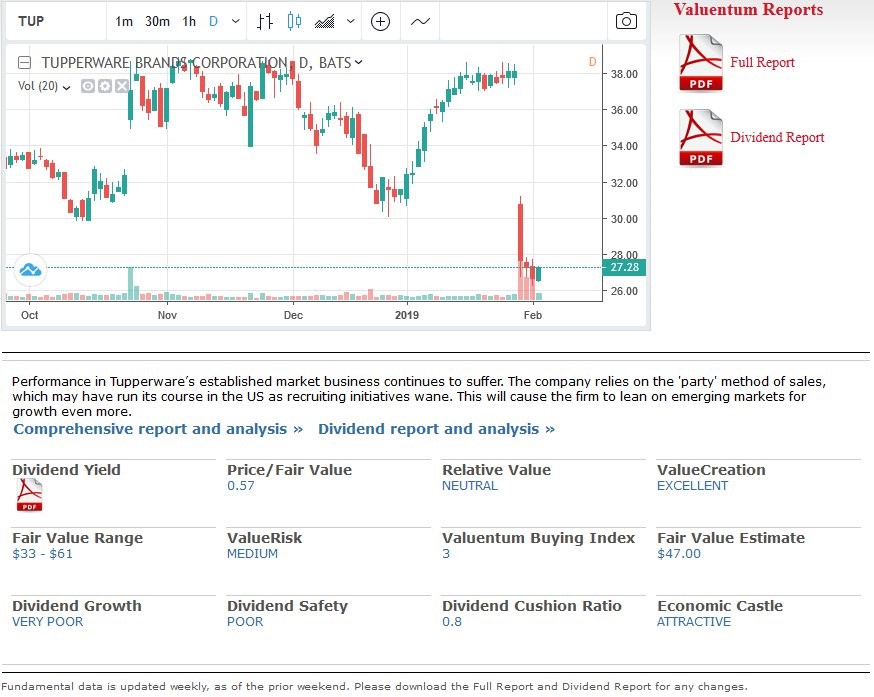
Image shown: Tupperware’s landing page at Valuentum after the company announced a ~60% dividend cut. Tupperware slashed its dividend before the Dividend Growth Newsletter hit your inboxes Friday evening. The company was included at the bottom of a list of companies with the highest multiplicative combination of Dividend Yield x Dividend Cushion ratio (mostly due to its outsize yield). The Dividend Cushion ratio flagged it as an outsize risk, nonetheless, and it was not included in any simulated newsletter portfolio. By Kris Rosemann On January 30, prior to the release of the February Dividend Growth Newsletter, Tupperware (TUP) announced that it would cut its dividend. The company had been yielding at a high-single-digit rate, but that was a red flag, as most yields of that level are, and the company's Dividend Cushion ratio has been below 1 since May 2018; it earns Dividend Safety and Dividend Growth Potential ratings of POOR and VERY POOR, respectively. Judging by the significant selling pressure its shares faced following the company’s announcement of its lowered quarterly payout, the market was surprised by the decision, but Valuentum members should not have been as taken aback. With a dauntingly (and unintentionally) high dividend yield and a Dividend Cushion ratio below 1, the company displayed multiple warnings signs that we harp on when it comes to Dividend Safety assessment. Quite frankly, in some respects, it just didn't need to keep paying out that lofty dividend yield in an environment of ultra-low interest rates, if shareholders weren't going to reward it with a higher price. Regardless, the writing was on the wall. Here’s what we had to say in the ‘Potential Weaknesses’ section of Tupperware’s dividend report: Tupperware's Dividend Cushion ratio is not what it once was. Free cash flow generation has fallen to $145 million in 2015 from nearly $255 million in 2013, and the firm's net debt position stood at roughly $594 million as of the end of 2017 (inclusive of short-term debt). Concerns over the company's performance in developed markets are valid, and its low market penetration rate in emerging economies speaks to the difficulties of operating in such markets. Currency movements will continue to impact reported results, and competing uses of capital will impact the firm's near-term dividend growth potential as management works to improve leverage. We think there are more compelling dividend growth options available. The company’s 16-page equity report also contained a warning of our lack of confidence in the payout due to its paltry Dividend Cushion ratio. For members that have not had the chance to dig in to the Dividend Cushion ratio, the following articles (along with Brian Nelson’s recent book, Value Trap: Theory of Universal Valuation) are highly-suggestive reading beyond the excerpts shared here: Update: Digging Into the Valuentum Dividend Cushion We want to find stocks that will increase their dividends for 25 years into the future, not use a rear-view mirror to build a portfolio of names that may already be past their prime dividend growth years. The Valuentum Dividend Cushion measures just how safe the dividend is in the future. It considers the firm’s net cash on its balance sheet (cash and cash equivalents less debt) and adds that to its forecasted future free cash flows (cash from operations less capital expenditures) and divides that sum by the firm’s future expected dividend payments. At its core, it tells investors whether the firm has enough cash to pay out its dividends in the future, while considering its debt load. If a firm has a Valuentum Dividend Cushion above 1, it can cover its dividend, but if it falls below 1, trouble may be on the horizon. Walking Through the Calculation of the Dividend Cushion Ratio Basically, if the ratio is significantly above 1, the company has financial capacity to pay out its expected future dividends, by our estimates. The higher the ratio, the better, all else equal. An elevated ratio doesn't ensure the company will keep paying dividends, however, as management's willingness to do so is another key consideration, but the ratio acts as a logical, cash-flow based ranking of dividend health, much like a corporate credit rating, for example, ranks a company's ability to pay back debt (default risk). The following image provides a depiction of the formula for the Dividend Cushion ratio, as explained in the above excerpt from “Update: Digging Into the Valuentum Dividend Cushion."
Tupperware has often found itself on our monthly screen of ‘The Financially-Healthiest Dividend Payers Yielding Over 2%,’ published in the Dividend Growth Newsletter. The screen mulitiplies a company's dividend yield and its Dividend Cushion ratio. However, it's important to note that it's just a screen of stocks based solely on that criteria and to also consider the information prominently displayed along with the screen: Note: The ‘Multiple’ in this list considers a company’s dividend yield and Dividend Cushion ratio as a multiplicative combination. Though it is a robust and largely objective measure, there could be exogenous or secular dynamics that could impact the business, where a dividend may not be as strong as the financials indicate. For example, GameStop (GME) is dealing with a secular shift toward digital gaming, while Abercrombie & Fitch (ANF) is navigating changing consumer preferences as millennials seek ‘experiences’ not ‘things’ (e.g. fashion). The Dividend Cushion is only one factor that we use in assessing the overall health of a company’s dividend. In this instance, Tupperware’s outsize dividend yield helped it make the list, but the Dividend Cushion ratio being below 1 should have been a clear warning. Also, a quick visit to the company’s landing page (image at top of article or click here) indicates that we have our fair share of concerns with secular declines around its business in established markets. We encourage members to continue to use all aspects of our research. The risks were clearly presented. That said, we’re not saying the Dividend Cushion ratio is perfect, and we’ve gone to great lengths to explain such a notion in the past, “Addressing the Intricacies of the Dividend Cushion Ratio,” but a company registering a ratio below parity alongside a stagnating business model is not a sign of strength in the payout. Nevertheless, we understand how investors may be feeling after management had previously stated its commitment to the payout, as it had tabbed a trailing payout ratio of 50% as its top priority of cash flow from operating net of investing activities as recently as November 2018. Traditional free cash flow performance disappointed in 2018, and the company’s explanation of the rationale behind the dividend cut may have left investors wanting more. Tricia Stitzel, President and CEO, offered the following commentary in the fourth quarter earnings release: ”To enable a more aggressive investment in our growth strategy initiatives and potentially fund share repurchases, we have made the decision to redeploy approximately $80 million in annual cash flow that had previously been paid out in quarterly dividends. The Board declared a 27 cents per share quarterly dividend, which results in an approximate 3% yield on a full year basis, and places us in the 70th percentile of dividend payors in the S&P 400. The investment into the business is expected to total approximately $100 million through 2022, enabling sales growth and providing direct annualized cost savings of about $50 million when fully implemented.” All things considered, we’re never happy to see a dividend get cut that may have significant negative implications for the portfolios of individual investors, but the Dividend Cushion ratio continues to highlight risks associated with unsustainable payouts, “Efficacy of the Dividend Cushion Ratio.” Tupperware had a Dividend Cushion ratio below 1, it had poor dividend health marks in its reports and on its stock page, and it was not an idea in either the simulated Dividend Growth Newsletter portfolio or simulated High Yield Dividend Newsletter portfolio. ----- Valuentum members have access to our 16-page stock reports, Valuentum Buying Index ratings, Dividend Cushion ratios, fair value estimates and ranges, dividend reports and more. Not a member? Subscribe today. The first 14 days are free. Kris Rosemann does not own shares in any of the securities mentioned above. Some of the companies written about in this article may be included in Valuentum's simulated newsletter portfolios. Contact Valuentum for more information about its editorial policies. |