
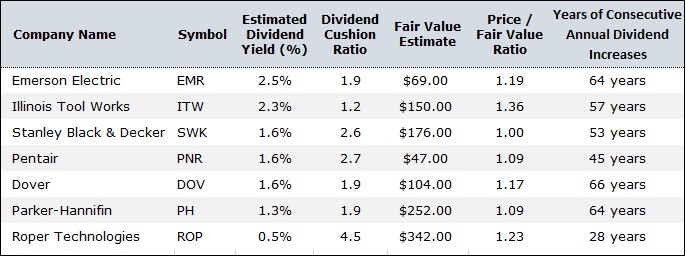
Image notes: The price-to-fair value ratio shows the relationship between the company’s stock price and our discounted cash-flow derived fair value estimate. Price is what you pay for the stock, while value is what you get. Price and fair value seldom equal. The savvy investor seeks to find stocks whose price is far below an informed forward-looking cash-flow-based fair value estimate of their intrinsic value. The Dividend Cushion ratio is a proprietary Valuentum measure that drives our assessment of the company’s Dividend Safety rating. The forward-looking measure assesses dividend coverage via the cash characteristics of the business. The Dividend Cushion is a ratio that sums the existing net cash (total cash less total long-term debt) a company has on hand (on its balance sheet) plus its expected future free cash flows (cash from operations less all capital expenditures) over the next five years and divides that sum by future expected cash dividends (including expected growth in them, where applicable) over the same time period.
By Valuentum Analysts
In the world of dividend growth investing, when a company hits the mark of raising its dividend for more than 25 consecutive years, it garners the coveted title of a Dividend Aristocrat. The accomplishment is so rare that only 65 companies in the S&P 500 have achieved this commendable feat–just 13%. Our strategic focus in the Dividend Growth Newsletter portfolio is to identify companies with attractive valuations, respectable dividend yields and strong expected dividend growth prospects for the next 25 years. This perspective is embedded within the construct of our proprietary and forward-looking Dividend Cushion ratio that can be found in each company’s Dividend Report.
In this article, however, let’s cover seven hidden and relatively overlooked Dividend Aristocrats from our Industrials coverage that have promising prospects to continue raising their dividends for many more years to come (three on the list have already raised their dividends for more than 60 consecutive years). The valuations of these seven companies may be a little stretched for our taste (at the time of this writing), but we think these stocks are worth keeping on your radar given their resilient business models, shareholder-friendly management teams, notable competitive advantages, and praiseworthy status as Dividend Aristocrats. Each of the companies’ 16-page Stock Report and Dividend Report can be downloaded following their respective profiles.
Emerson Electric (EMR)
• Emerson offers a wide range of products and services in the industrial, commercial and consumer markets through its ‘Automation Solutions, ‘Climate Technologies’ and ‘Tools & Home Products’ businesses. Roughly half of its business comes from the Americas. The company was founded in 1890 and is headquartered in St. Louis, Missouri.
• Emerson has a fantastic dividend growth profile and impressive track record. Management targets a dividend-to-free cash flow ratio of 40%-50%. The firm’s dividend yield and Dividend Cushion ratio offer an enticing combination, but annual dividend growth has been modest of late (1%-2%). It plans to elevate yearly increases to 3%+ in coming years, however.
• Emerson expects global demand trends to continue improving, with strength in Asia and North America leading the way. Organic growth will be bolstered by bolt-on acquisitions, including its purchase agreement for GE’s (GE) Intelligent Platforms business, which should boost its position in automation.
• Emerson sold its network power division for $4 billion and its motor and generator business for $1.2 billion, and it purchased Pentair’s valves and controls business for $3.15 billion. It also acquired Textron’s Tools & Test business for $810 million and smart pneumatics technology producer Aventics for €527 million. EPS of $5.00+ is expected in 2023 (up from $3.24 in fiscal 2020).
• The company has diversified end market exposure with ~20% of its sales coming from the oil and gas space, residential (~15%), chemical (~10%), power (~10%), commercial (~10%), and the balance coming from various industrial/refining and life sciences applications.
Key Dividend Strengths
Emerson serves a variety of industrial, commercial and consumer markets, some of which are cyclical, but many of which have long-term secular trends supporting them. The company has increased its dividend for each of the past 60+ years, earning it a place on the Dividend Aristocrat list. Strong free cash flow generation has been the base on which Emerson has built this impressive dividend track record, and though free cash flow dipped in fiscal 2017, it averaged roughly ~$2.4 billion in annual free cash flow generation over the past three fiscal years (2018-2020). We think this free cash flow generation and a reasonable balance sheet will support continued dividend increases moving forward.
Potential Dividend Weaknesses
Even though Emerson has strong historical free cash flow generation, future levels may be pressured as a result of the outbreak of COVID-19, but its cash conversion rate remains solid. It can be expected to continue pursuing acquisitions and buybacks, which could allocate billions of dollars in capital away from dividends. Normalized free cash flow generation should benefit from a focus on improved working capital performance and prudent capital spending. All things considered, we are not anticipating any material weakness in Emerson’s payout anytime soon, and the firm is targeting a dividend-to-free cash flow ratio of 40%-50% over the long haul. Recent annual dividend increases have been modest.
Download Emerson’s 16-page Report >>
Download Emerson’s Dividend Report >>
Illinois Tool Works (ITW)
• Famous for its 80/20 business process that focuses on what is most important (the 20% of the items which account for 80% of the value), Illinois Tool Works is a multi-national manufacturer of a diversified range of industrial products and equipment. The company was founded in 1912 and is headquartered in Glenview, Illinois.
• ITW has several operating segments: Automotive OEM, Food Equipment, Test & Measurement, Welding, Polymers & Fluids, Construction Products, and Specialty Products. Normalized operating margins in the Automotive OEM, Welding, and Specialty Products segments are north of 20%.
• Though COVID-19 has made business more challenging, ITW’s annual goals for the period 2018- 2022 are as follows: 25%+ operating margin, 20%+ after-tax ROIC, 3%-5% organic growth, ~35% incremental margins, 8%-10% EPS growth, and free cash flow at 100%+ of net income. Management is focused on organic growth and believes it does not need acquisitions to achieve such goals.
• ITW is not expecting strong performance in the near term. Though it has a very high-quality business portfolio, the demand environment remains difficult across most of its segments due to COVID-19. Organic growth has been negative in both 2019 and 2020; we’ll be monitoring trends going forward.
• Illinois Tool Works targets a 1% average annual reduction in spend per year, but significant raw materials cost headwinds have provided a drag on its margin performance more recently. These cost reductions are not ‘deferred increases’ or ‘cost avoidance,’ but are identified as real savings.
Key Dividend Strengths
Though orgranic revenue performance of Dividend Aristocrat ITW has been negative more recently, organic expansion is targeted at 3%-5% annually through 2023, while the executive team’s focus is on driving operating margins and after-tax ROIC higher. ITW uses a proprietary 80/20 business process, and its commitment to this focus is as strong as ever. Management is targeting 100%+ free cash flow conversion and a disciplined capital allocation strategy, which includes getting its payout ratio to ~50% in 2023. The company has raised its dividend in each of the past 50+ years. Free cash flow has averaged ~$2.4 billion during the past three years (2017-2019).
Potential Dividend Weaknesses
There aren’t a lot of bad things to say about ITW and its dividend. In many ways, the company’s business processes are among the best not only in our industrial coverage but also across our entire analytical universe. ITW’s dividend has experienced a nice double-digit CAGR since 2012, and management recently tabbed a greater percentage of cash flow from operations to be allocated to the payout. Management routinely targets free cash flow at 100%+ of net income, but competing capital allocation options are notable. Buybacks absorbed ~$4.5 billion in capital in 2017-2019, and total debt stood at ~$7.8 billion at the end of 2019.
Download Illinois Tool Works’ 16-page Report >>
Download Illinois Tool Works’ Dividend Report >>
Stanley Black & Decker (SWK)
• Stanley Black & Decker provides power and hand tools, mechanical access solutions, and electronic security and monitoring systems for various industrial applications. Approximately 60% of the firm’s revenue is generated in the US. The company traces its roots back to the 1840s and is headquartered in Connecticut.
• Stanley merged with Black & Decker in 2010 and created a firm with tremendous brand strength. We like the combined entity, but it still remains exposed to stiff competition and fluctuating raw material costs, which can hinder profit expansion. Commodity inflation is always a threat to margins.
• Stanley Black & Decker has undergone a notable transformation since the turn of this century from a small cap buildings products firm to a large cap diversified industrial company. The company has spent over $10 billion on acquisitions since 2002, and while more deals are in the pipeline, it remains committed to delivering above-market organic growth with profitability expansion.
• Stanley Black & Decker continues to work to transform its portfolio. It plans to move its ‘Tools & Storage’ segment to less than 60% of total revenue by 2022 from ~66% in 2016, while ‘Industrial’ is expected to grow to 25% from 16% and ‘Security’ shrinks to 16% from 18%. Organic revenue growth is expected to be ~4%-6% through 2022.
• The company has paid a dividend consecutively for 140+ years and has increased it in each of the past 50+ (since 1968). We expect management’s goals to accelerate organic growth and increase emerging markets exposure to support the ongoing trend.
Key Dividend Strengths
From a building products company with $2 billion in sales in 2000 to a diversified industrial entity with $14+ billion in revenue, it’s been an amazing journey for Stanley Black & Decker. But there is a bigger story to tell for income investors. Stanley Black & Decker has paid a dividend for 140+ consecutive years, and it has increased the payout in each of the past 50+ years. The company is #1 in tools and storage, #1 in engineered fastening, and a top player in commercial electronic security services, and we can’t say enough about its established, global franchises. Management points to a strong and growing dividend as a key reason to invest in its company, and frankly, the company’s track record speaks for itself.
Potential Dividend Weaknesses
A focus on cost containment and ongoing price/mix management will be par for the course to keep operating results and its dividend moving in the right direction. The company has been active with share buybacks as of late, but we think this speaks more of the cushion it has with respect to the dividend than anything else. A lot would have to go wrong for management to simply decide not to raise the payout in any given year, in light of its near half-century dividend growth track record. The company has a notable net debt position, but free cash flow generation averaged ~$940 million in 2017- 2019 (dividend obligations are ~$400 million per annum). We expect strong coverage to continue.
Download Stanley Black & Decker’s 16-page Report >>
Download Stanley Black & Decker’s Dividend Report >>
Pentair (PNR)
• After the separation of its Electrical business in 2018, UK-based Pentair is now a pure play water company focused on sustainable water/fluid processing applications. It provides solutions for residential (~60% of sales), commercial (20%), and industrial/agriculture (20%) applications. It has two segments: ‘Consumer Solutions’ and ‘Industrial & Flow Technolgies.’ Pentair was founded in 1966.
• An enhanced strategic focus, simplified corporate structure, and improved clarity into business performance were key benefits of the separation, and geographic expansion remains a growth opportunity. Its former Electrical business has been named nVent Electric and trades under the ticker ‘NVT.’
• Pentair’s long-term financial goals include 2%-4% annual core sales growth, 6%-8% segment income growth, and 8%-10% adjusted earnings per share growth as it takes advantage of operating margin and share buyback opportunities. The company also expects to deliver free cash flow equal to adjusted net income, with free cash flow averaging ~$300 during the past three years (2017-2019).
• Pentair is working to transform its business into one that is more predictable via simplification and standardization initiatives, which are expected to help drive net income margins along with pricing initiatives in coming years. Management estimates that ~70% of Pentair’s revenue comes from replacement/aftermarket after the nVent separation.
• Pentair’s robust free cash flow supports its capital allocation plan that includes tuck-in and bolt-on M&A activity as it embraces ‘smart’ technologies. The company has grown its dividend for 40+ years, as adjusted for the separation. It retains excellent free cash flow coverage of the payout.
Key Dividend Strengths
The new Pentair boasts a significantly stronger Dividend Cushion ratio than its predecessor thanks in part to a materially lower debt load. The company also has ~70% of its revenue tied to replacement/aftermarket demand, which should make its business less sensitive to the economic cycle compared to the ‘old’ Pentair. Its long-term financial goals include 2%-4% annual sales growth, 6%-8% segment income growth, and 8%-10% adjusted earnings per share growth as it works to take advantage of operating leverage. Free cash flow is targeted at ~100% of adjusted net income in any given year, which would help drive its dividend growth potential. We’re expecting ongoing increases in the dividend.
Potential Dividend Weaknesses
A lower debt load (for the former consolidated company) and what should amount to a business that is less sensitive to changes in the economic cycle are two key factors in Pentair’s improved Dividend Cushion ratio. If management is able to deliver on its goal of achieving free cash flow of ~100% of adjusted net income on a consistent basis, there isn’t much that will derail the dividend, in our view. However, competing capital allocation options are present as the company has repurchased ~$850 million in stock during the past three years (2017-2019). Yearly free cash flow has averaged ~$300 million over the same time period, well in excess of its current annual dividend payment run-rate of ~$125 million, however.
Download Pentair’s 16-page Report >>
Download Pentair’s Dividend Report >>
Dover (DOV)
• Dover is a diversified firm that makes a broad range of specialized products. The company operates under five segments: Engineered Products, Fueling Solutions, Imaging & Identification, Pumps & Process Solutions, and Refrigeration & Food Equipment. It spun off its upstream energy business in 2018. Dover was founded in 1947 and is headquartered in Downers Grove, Illinois.
• Dover’s free cash flow (FCF) generation has been excellent. During the past three years (2017-2019), Dover has averaged free cash flow of ~$670 million, or ~9% of sales. The company aims to generate FCF of 8%-12% of revenue through the course of the economic cycle.
• Dover’s goals include growing organic revenue at a GDP+ (3%-5%) pace, improving returns on capital via margin improvement, and returning capital to shareholders through growing dividends. Management will invest behind the core and increase its exposure to growth markets over time. Profitability should benefit from synergy capture of recent deals, but disciplined capital allocation will be key.
• COVID-19 has put a temporary damper on Dover’s growth plans, but the company is working hard to realize its long-term potential. After strengthening its execution, it plans to pursue acquisitions to build out platforms while working to drive margin improvement via footprint optimization and automation. Efficient growth will be a priority.
• Dover has an impressive track record of raising dividends. 2020 marked 65+ consecutive years of increases. The company’s yield is not as high as others’, but capex in the 2%-2.5% of revenue range speaks to its solid free cash flow generating ability, supporting the payout.
Key Dividend Strengths
Dover is a Dividend Aristocrat, and its operating environment was perhaps never more difficult for the company than the recent past. We like the company’s relatively asset-light operations, especially for a manufacturer, and the recent separation of its wellsite business should significantly enhance its protection from cyclical end markets. Such a risk has not fully gone away, however. The company retains a healthy investment-grade corporate credit rating, but it does hold a net debt position. Management is targeting free cash flow of 8%-12% of sales, which should support the dividend payout. We expect the company to continue its consecutive annual dividend growth streak.
Potential Dividend Weaknesses
The largest risks to Dover’s consecutive annual dividend streak are its net debt load and the uncertainty that persists in the energy markets. However, the separation of the company’s wellsite business has significantly reduced its dependence on cyclical end markets. Management is targeting annual organic sales growth of GDP+ through over the long haul, along with high-single-digit EBIT growth. Execution risk is present, and the energy markets must cooperate for this to be achieved. A continued focus on operating efficiencies through its Dover Excellence Program will be par for the course to ensure ongoing dividend expansion in the current volatile operating environment.
Download Dover’s 16-page Report >>