Member LoginDividend CushionValue Trap
|
IBM Continues to Punish Optimists
publication date: Oct 20, 2015
|
author/source: Brian Nelson, CFA
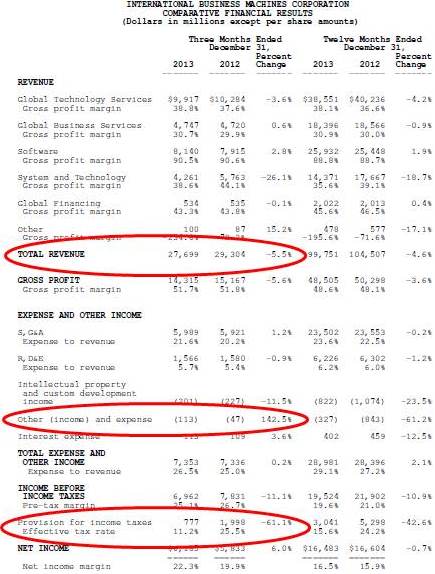
The fundamentals of International Business Machines (IBM) have deteriorated so much in the past few years that we use the technology giant as our in-house example to explain poor earnings quality. Can you believe it? The bluest of blue chips is now the poster child for what it once was the opposite of. We wrote the following in January of 2014, which addresses the myriad red flags when IBM was still trading close to $190 per share. Let's explore what we said then to help establish a foundation for evaluating its third-quarter results, released October 19, 2015: Never did we ever think we’d be using Big Blue as an example of poor earnings quality, but its fourth-quarter 2013 results, released January 21, 2014, fit the mold. Let’s first become acquainted with why assessing earnings quality is important. According to the Research Foundation of the CFA Institute: Understanding the quality of earnings is an essential part of processing and interpreting information. A high-quality earnings number will (1) reflect current operating performance, (2) be a good indicator of future operating performance, (3) and fairly annuitize the intrinsic value of the company. At Valuentum, there are five basic areas that we evaluate to assess the quality of a firm’s earnings: a) is the company’s earnings growth driven by higher-quality revenue expansion or lower-quality cost-cutting measures (can the trajectory of earnings be sustained with continued revenue increases because cost-cutting, by definition, is a finite activity?); b) has the company benefited from one-time items and/or an abnormally low tax rate to bolster net income (is the company shifting items from one period to the next?) c) has the company engaged in aggressive share buybacks to bolster earnings per share (is management incentivized based on return on invested capital or accounting earnings per share, the latter not always in the best interests of shareholders?); d) does the company convert 100%+ of its net income into cash flow from operations (are the earnings it generates truly cash earnings or are they more an accounting measure?); e) was there a large re-classification of costs and/or segments that muddied the performance (is the company trying to hide something?). There are other items to consider in evaluating the quality of earnings—including assessing depreciation methods and other more fraudulent activity that can impact reported net income such as creating fictitious revenue and/or failing to record expenses—but for the most part, the five reasons outlined above cover the topic quite well in practice. In IBM’s fourth-quarter 2013 income statement shown below, we have encircled three items that stood out to us. Can't view images? Download income statement here. See page 7.
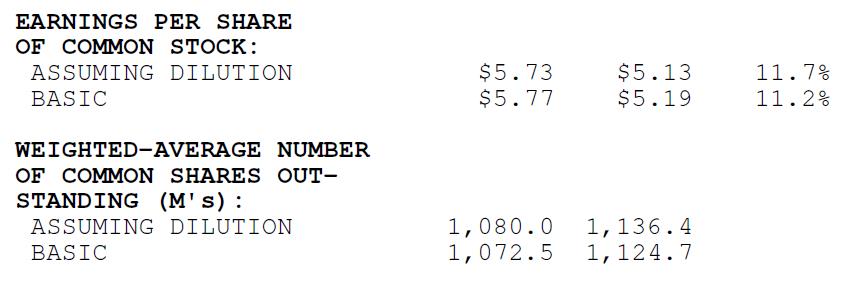
Image Source: IBM The first is revenue growth. IBM’s fourth-quarter 2013 revenue dropped 5.5%, a pace that exceeded that of the 4.6% drop for the year, indicating an acceleration of the revenue decline. We’re viewing this as a sign that the worst may still be ahead of Big Blue as it tries to steer the company back to growth. Without a solid backdrop of revenue growth, earnings-per-share expansion will have to come either from lower quality cost-cutting, one-time items, or share buybacks. Interestingly, IBM didn’t cut operating costs faster than the revenue declines in the period, as SG&A and RD&E as a percentage of revenue expanded, to 21.6% (up 140 basis points) and 5.7% (up 30 basis points), respectively. Clearly, revenue and costs are moving in the wrong direction at IBM. But IBM still reported a 6% increase in net income and a 240 basis point improvement in its net income margin for the quarter (see bottom two lines of the image above). Let’s examine how it did so by looking at the two other encircled items on its income statement. ‘Other (income) and expense’ advanced by $66 million—the measure is an offset to expenses, which is why it is a negative. Second, IBM’s tax rate (‘Effective tax rate’) tumbled significantly. Big Blue’s net income was more than $1 billion higher than it otherwise would have been (the ‘Provision for income taxes’ declined more than 60%). Given the declining revenue, increasing costs, and the one-time items that have benefited the firm (other income and a lower tax rate), the company’s earnings quality in the fourth quarter was very poor. The quality of earnings expansion, however, was muddied even further. IBM bought back more than 50 million shares of stock (1,072.5 million versus 1,124.7 million), which further boosted headline earnings per share. On a diluted basis, IBM recorded 11% earnings-per-share growth, but there wasn’t anything fundamental in the quarter that should have driven such strong bottom-line expansion. Said differently, the buybacks acted as an artificial means to hide weakening underlying fundamentals.
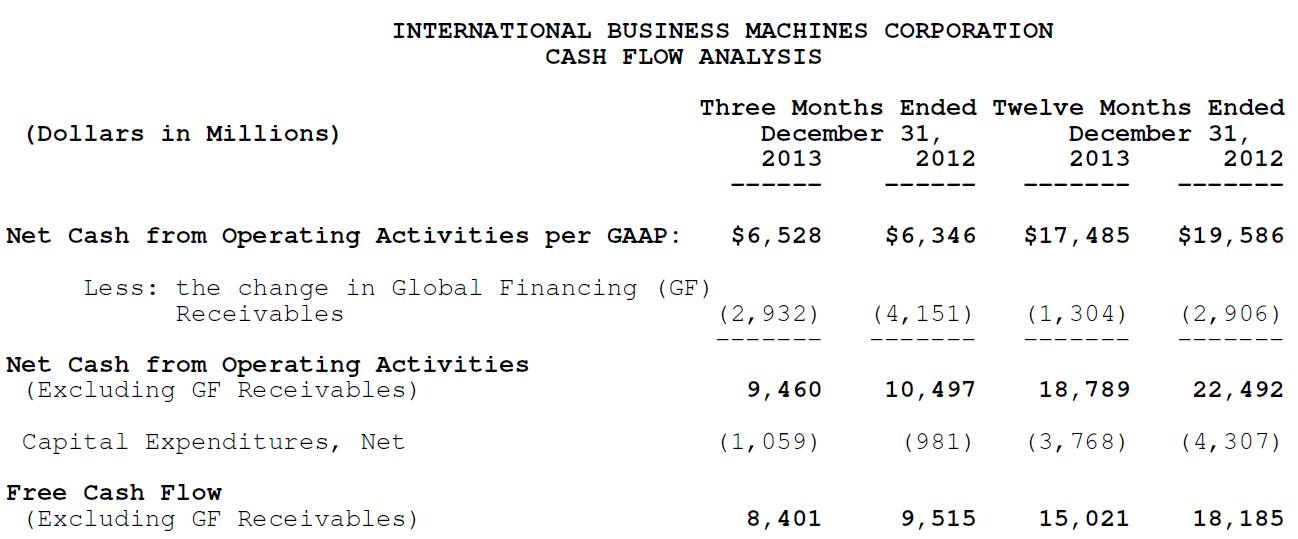
Image Source: IBM Another important consideration in assessing earnings quality is to ascertain whether cash flow from operations is increasing at a pace (or is at a level that is) consistent with net income expansion. If it isn’t, then the earnings the firm is posting on the income statement are more accounting-based than cash-flow based. For IBM, net cash from operations per GAAP is slightly higher than accounting earnings on the income statement (in the quarter and on an annual basis), so the possibility of any serious financial shenanigans at Big Blue is remote, in our view. On an annual basis, however, the decline in net cash from operating activities ($18.79 billion versus $22.49 billion) was much steeper than the fall in net income for the year ($16.5 billion versus $16.6 billion). Free cash flow trends weren’t that great either. As a percentage of net income, free cash flow fell to 91.1% in 2013 from 110% in 2012. The pace of the free cash flow decline was much steeper than that of net income on an annual basis.
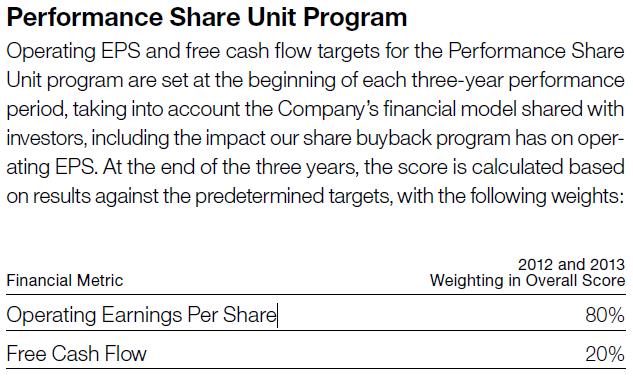
Image Source: IBM Still, the steeper drop in cash flow (both operating cash flow and free cash flow) relative to the fall in net income shouldn’t be that surprising. A look at the breakdown in incentive compensation in IBM’s proxy statement reveals more of a focus on operating net income (60% weighting in executives’ annual incentive program) and operating earnings per share (an 80% weighting in executives’ performance share unit program) than anything else. See page 34 of 2013 proxy statement here and/or image below. As shareholders, we often get what we incentivize management to do.
Image Source: IBM Valuentum’s Take As a matter of better corporate governance, we’d like to see a greater focus on return on invested capital (ROIC) and economic profit (EVA) than accounting measures at IBM. We think long-term performance will benefit from this re-focus. IBM didn’t engage in any large re-classifications to complicate year-over-year comparisons, but the firm’s quarterly results fly in the face of what we and the Research Center for the CFA Institute characterize as high-quality earnings. The fourth quarter 2013 was not (1) reflective of current operating performance, (2) a good indicator of future operating performance, and (3) helpful in assessing the intrinsic value of the company. We wouldn’t be interested in looking at shares of IBM until it fell towards the lower end of the fair value range (see its 16 page report). The best ideas are always included in the Best Ideas portfolio and Dividend Growth portfolio. The low end of IBM's fair value range stands in the mid-$130s today, and we're still practicing patience. What a nightmare the company is experiencing, as it rested on its laurels, counting on share buybacks to achieve its previous operating earnings per share targets that were only recently taken down. The executive team simply stopped looking to generate economic value with new investments, feeling confident in the status quo and that share buybacks would help meet any shortfalls in earnings per share targets. Why Warren Buffett got involved in this company is beyond us, but we think he, too, was sucked into the promises of ever-increasing earnings per share, abandoning his tried-and-true ROIC and cash-flow based framework. Declining revenue does not, in any way, speak to a company that has an economic moat. The Oracle of Omaha has fallen short with this idea... IBM's third-quarter 2015 results left even more to be desired, especially since they came accompanied with a downward guidance adjustment in earnings per share for the year, now expected in the range of $14.75-$15.75, was $15.75-$16.50 per share. The midpoint of the new target range was below the consensus estimate of $15.68, revealing that IBM's fundamental performance continues to deteriorate even faster than expectations. The whopping 14% decline in revenue in the quarter speaks of an "eroding" company and the makings of a value trap, if a case can be made after the price drop that IBM's shares are undervalued, which we do not think they are. GAAP net income from continuing operations dropped 13% in the third quarter, even as the tech giant continues to benefit from a lower tax rate. Diluted earnings per share during the period dropped materially as well, as gross share repurchases of $4 billion during the past 12 months did little to migitage the pace of the decline. IBM remains a strong free cash flow generator, but its fundamentals are weakening, and the mere presence of robust free cash flow does not make for a great investment idea. The future free cash flow stream must be mispriced relative to expectations, and with full-year 2015 free cash flow to be "relatively flat" compared to last year's mark, there's not a strong case to be made that IBM is a "growing perpetuity," a huge risk to traditional valuation techniques betting on the long-term prosperity of IBM. If the tech giant is past its prime, entering a phase of permanent decline, shares have even more sledding ahead of them. We've said it many a time before, and we'll say it again: we're only interested in "Big Blue" below the low end of the fair value range, in the low-$130s. Sorry Uncle Warren.
|