Member LoginDividend CushionValue Trap
|
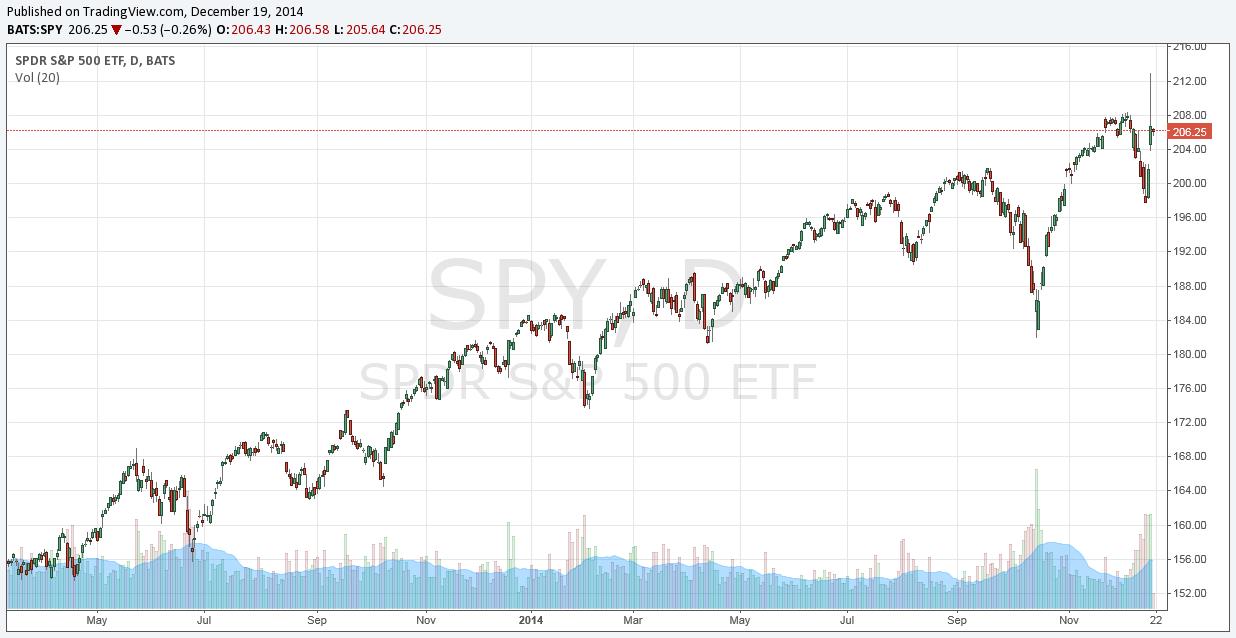
Stocks Catapult Back To Near All-Time Highs
publication date: Dec 19, 2014
|
author/source: Brian Nelson, CFA
It appears that we may get a Santa Claus rally after all. Call it window dressing. Call it drinking at the Fed’s punch bowl. Call it what you will. But the Dow Jones Industrial Average (DIA) polished off its biggest two-day gain in six years to propel itself back to near all-time highs again. The S&P 500 (SPY), shown above, is now within throwing distance of setting new record ground, and spirits remain high as we approach the Christmas holiday and New Year. Collapsing prices at the gas pump, though highlighting risks to global economic growth, may be helping to spread the holiday cheer. For clarification, we continue to be optimistic about the future returns in the newsletter portfolios, but that doesn’t mean that we can’t be cautious on the broader stock market. In fact, we think it is healthy to have varying opinions, if appropriate, about individual equities and the broader stock market, in general. This isn’t an inconsistency in thought process, but an acknowledgement that the drivers behind individual equities and the broader stock market are not 100% correlated. For example, it is perfectly fine for us to say that we’re big fans of Microsoft (MSFT) and Gilead (GILD), but that we’re very concerned about overall market returns during the next few years. Both opinions are valid. This week, there were a number of relatively healthy outlooks released in the industrial space (see here and here), and we received some good news from Oracle (ORCL), which we include on our list of ‘Stocks That Are Cheap on Both a DCF and Relative Value Basis, as of December 15.’ The cloud and data center tech giant experienced stronger than expected hardware sales when it reported fiscal second quarter results December 18. The underpriced company soared to new highs and brought buyers across much of tech this week, to Microsoft, Cisco (CSCO), and EMC (EMC) to Splunk (SPLK), Red Hat (RHT), and even to beaten-down IBM (IBM), which is struggling to right its own ship (see here). Microsoft, Apple (AAPL) and Cisco remain three of our favorite ideas in big cap tech. The Federal Reserve’s statement that it would remain “patient” about raising rates continues to offset the reason why crude oil prices are declining (global recession fears), shockwaves in the REIT sector as a result of American Realty Capital’s (ARCP) accounting shenanigans, and geopolitical uncertainty impacting Sony (SNE), and the major theater chains including Regal (RGC) and AMC (AMC), regarding the decision to pull the release of The Interview. The Fed is very much in charge of the equity markets these days on account of the current level of interest rates. Yield-seeking investors of the baby boom generation have few options to achieve income growth in their portfolios, with the rare exception of dividend growth equities and real estate with embedded rent escalators. Any move upward in interest rates will almost surely negatively impact the equity markets. The Fed knows this and is walking a fine line. Regarding the newsletter portfolios, we’re actively looking for new ideas, but we don’t mind being patient. As is often the case, the best ideas may already be in your portfolios – and it is not written in stone that you have to add a new and different idea to your portfolio to absorb any incremental investment capital. If, for example, you like a company that’s already in your portfolio, sometimes the best investment is continuing to add to that position, up to the point, of course, where concentration risk outweighs the benefits of the potential outsize return. At the moment, we’re happy with how the newsletter portfolios are performing. The December editions of the Dividend Growth Newsletter and Best Ideas Newsletter can be found here and here. We wanted to address a question that keeps coming up regarding the Valuentum Buying Index: Why does the VBI rating fall when a firm’s stock price falls? This is a very good question because it does seem counter-intuitive. There are a couple things at work. First, just because a stock price has fallen doesn’t mean the company is cheaper. It is possible (and sometimes likely) that the value of a company has fallen by a greater amount than its stock price, and shares are actually more expensive than before the price drop. The descriptors, “cheap” and “expensive,” will always be in relation to the price-versus-value comparison, not the price alone. Of course, a stock can become cheaper if its share price declines and intrinsic value remains the same. Second, in any investment framework, there will always be risk to the estimate of intrinsic value because intrinsic value will always be based on the future, and we all know that the future is inherently unpredictable. So, in addition to using a relative valuation overlay to double-check the discounted cash-flow process, we use a company’s market price as an information mechanism to further gain conviction in the overall valuation thesis. For example, when a company’s share price falls (its technical and momentum indicators wane), the risk to the valuation thesis is greater because there are more investors that are betting against our thesis and the company (remember: selling causes a share price to drop). This is why, for example, Gilead’s Valuentum Buying Index rating can drop from a 10 to a 6, even though nothing really has changed with respect to the valuation thesis. On the other hand, when a company’s share price rises, the risk to the valuation is reduced because there are more investors betting in our favor (remember: buying causes a share price to rise). We are more likely to be right when the market is with us than when the market is against us. After all, the market has to eventually agree with us in order for any idea to work out, the third component of the “The 13 Most Important Steps to Understand the Stock Market.” In addition to utilizing a robust valuation framework, the Valuentum Buying Index rating captures the information embedded in a company’s stock price movements, making it one of the best sorting methodologies. The flow chart that derives each firm’s Valuentum Buying Index rating can be found here (pdf). Note: Our team will be moving into a new expansion office from December 17 through December 31. We may be a little tardy in responding to emails during this period. We apologize for any inconvenience. |