Update: Frequently Asked Questions About Valuentum Securities, Inc.
![]()
What is Valuentum Securities?
Valuentum (val∙u∙n∙tum) [val-yoo-en-tuh-m] Securities Inc. is an independent investment research publisher, offering premium equity reports and dividend reports, as well as commentary across all sectors/companies, a Best Ideas Newsletter (spanning market caps, asset classes), a Dividend Growth Newsletter, modeling tools/products, and more. Independence and integrity remain our core, and we strive to be a champion of the investor. Valuentum is based in the Chicagoland area.
Valuentum is not a money manager, broker, or financial advisor. Valuentum is a publisher of financial information.
How do I subscribe to Valuentum’s investment research services?
1) Click the following link: https://valuentum2.ssl.subhub.com/subscribe.
2) Select your currency, either United States Dollars or United Kingdom Pounds.
3) Click the Next button.
4) Select your membership plan.
5) Click the Next button.
6) Enter your contact details.
7) Click the Next button (or depending on your browser, you will be auto-forwarded to PayPal's secure site).
8) Click the PayPal button to pay through PayPal.
9) Complete your purchase.
10) Your payment profile may be recurring, so please check that your settings in PayPal are as you desire.
Need to pay by debit/credit card? Click here.
How do I login? Where can I find Valuentum reports on my stocks? And where can I become more familiar with how to best use Valuentum’s website?
For the most recent navigation video, please click here.
Visitors can access a presentation walking through the 16-page reports at the following link (pdf):
http://www.valuentum.com/downloads/20141120/download
How much does a membership cost?
We offer membership services for as much as $119.99 per month or more, or as little as $29.99 per month, depending on which level of service you choose. If you haven’t already, please preview our membership options as the first 14 days are free under any plan (with the exception of the Valuentum Exclusive, High Yield Dividend Newsletter and additional options commentary). The Valuentum Exclusive can be accessed for $1,295/year and is limited to 1,000 members.
Please view more information about the Exclusive publication at the following link:
https://www.valuentum.com/articles/20160505
Is it safe to subscribe to Valuentum.com?
We use PayPal to securely process online payments at Valuentum. Your credit-card information is never displayed on our website – or sent to or from our website.
What is Valuentum’s privacy policy?
Our privacy policy can be viewed at the following link:
http://www.valuentum.com/static/privacypolicy
What is Valuentum’s cancelation policy?
When you begin your membership, we do not accept payment from you. Only when the first 14-days free period ends will you then be charged the subscription fee. Your subscription will automatically renew on the basis of your payment cycle.
If you are not happy with our service for any reason, cancel within 14 days of your start date (during the free period) by emailing info@valuentum.com saying that you would like to cancel. You will not be charged anything.
After the first 14 days, you may cancel at any time, and we will recalculate the cost of the subscription for the period the subscription was used (at current applicable monthly rates) and will refund any difference less transaction fees. No refunds are provided for monthly subscriptions or for the Valuentum Exclusive publication, High Yield Dividend Newsletter, or additional options commentary. The Valuentum Exclusive publication, High Yield Dividend Newsletter, and additional options commentary also do not have a free period.
Your complete satisfaction is our top priority. Information on how to cancel a membership >>
How frequently are the (stock and dividend) reports updated and what triggers an update?
The 16-page stock and dividend reports are updated as needed and generally when material results alter our estimate of a company's fair value. This update cycle is typical for investment research firms. Fair value estimates do not change much over short-term periods of time, especially if our estimate of a company's intrinsic value is spot on.
Although the date, data, or text on our reports may not change daily for each company, one can assume that if the reports are live on the site, the conclusions of the company in the report are still representative of our view on the stock or its dividend. We only focus on material changes.
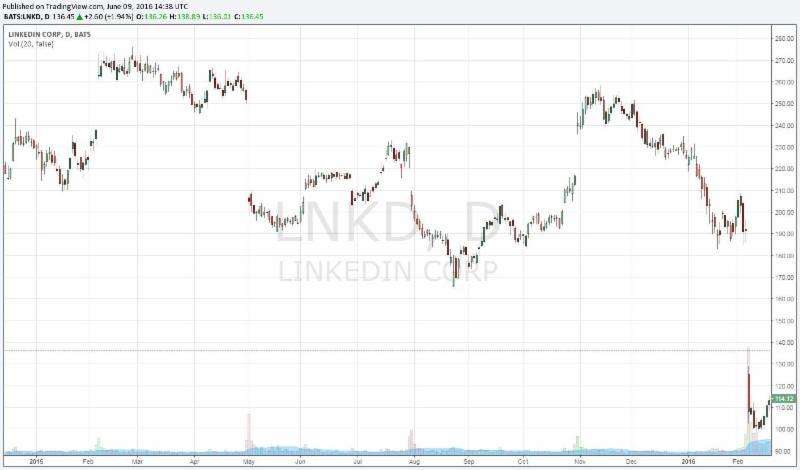
Importantly, by using our 'Symbol' search box in our header, one can gain access to some of the most advanced charting features to augment our Valuentum Buying Index's technical/momentum assessment. The charts are equipped with real-time data. The 'Symbol' search box in our website header is also the best way to find our recent articles and analysis (as well as the 16-page equity and dividend reports) on companies of interest to you.
Pasted below is what the search box retrieves on information related to Intel (INTC), for example:
http://www.valuentum.com/search2?searchtext=intc&searchtype=symbol
How do some readers use Valuentum's services?
Please select the following link to learn more:
http://www.valuentum.com/articles/How_to_Use_Valuentums_Investment_Services
What are the advantages of using Valuentum’s investment services?
1) We're independent – we limit conflicts of interest
2) Integrity and systematic application of analytical process
3) Diversified investment research provider – from deep value through momentum investing
4) Breadth and depth of stock, dividend, and ETF coverage
5) Discounted cash flow valuation experience
6) Fair value estimates for stocks in our coverage universe
Download (pdf): "How Well Do Enterprise-Cash-Flow-Derived Fair Value Estimates Predict Future Stock Prices? -- And Thoughts on Behavioral Valuation"
7) Unique and cash-flow based dividend growth process
8) Strong performance track record versus peers
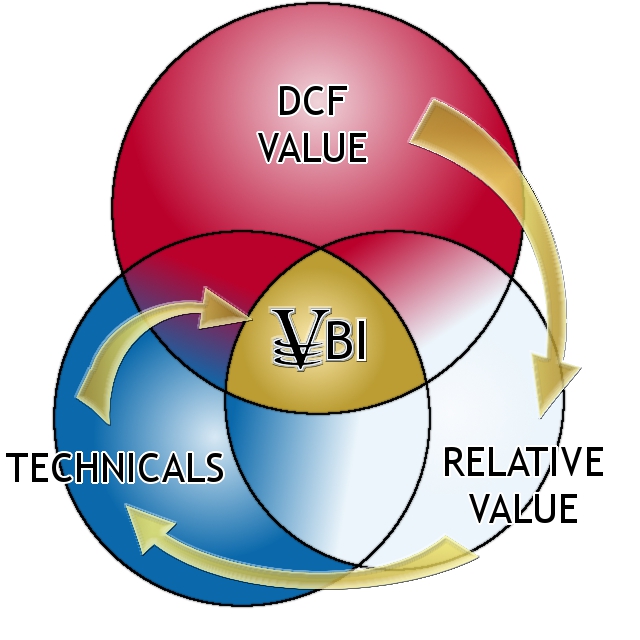
What is the Valuentum Buying Index (VBI)?
Download (pdf): "Value and Momentum Within Stocks, Too"
Please click the following link to learn more about our stock-selection methodology:
http://www.valuentum.com/articles/20110622
Why does a stock have a good Valuentum Buying Index rating but a poor dividend growth profile?
The intrinsic value of a stock (company) is independent of the size or quality of its dividend payment or its dividend growth profile. Note: dividend payments are just a portion of a firm’s total free cash flow (earnings), and intrinsic value is driven by all of the future free cash flows (earnings) that belong to shareholders.
The discounted cash-flow valuation process for firms rests on assessing the discounted future free cash flows of an entity in arriving at a fair value estimate for that entity. We then use a margin of safety to better pinpoint an entry/exit point that captures the risks inherent to the company's business model. After doing this and conducting a relative value assessment, we then evaluate the technical and momentum indicators of the firm to further reinforce our entry/exit points. This process culminates in our Valuentum Buying Index (VBI), which uses a rigorous DCF evaluation, relative value assessment, and technical and momentum indicators to derive a score between 1 and 10 (10=top pick).
When evaluating a company’s dividend, we sum the future expected free flows of the firm and divide that sum by future expected dividend payments over a five-year period (and consider the company's net balance sheet impact). If this relationship is below parity (1), we don't think the firm's dividend growth potential is strong. In other words, this analysis reveals the company doesn’t have a significant amount of capacity to raise the dividend. However, that doesn't mean the shares of the exact same company aren't undervalued and that investors aren't interested in other parameters that drive the company’s VBI rating -- which we think captures the major factors that drive a firm's future capital appreciation potential.
All things considered, it is perfectly consistent for a company to score high on our VBI scale and not have strong dividend growth prospects. Alternatively, it is perfectly consistent for a firm to score low on our VBI scale and have strong dividend growth prospects.
What web browser should I use to operate Valuentum.com?
Our website works best on Internet Explorer 9, Chrome, Firefox or Safari. You can click on the links to download them for free. Since the charts we use on our website have html5, Internet Explorer 8 and previous versions of web browsers do not support them.
Where can I get an education on the methodology and technical definitions of the terms used in your service?
President of Investment Research Brian Nelson's book, Value Trap, is by far the best place to start learning about our thoughts and processes.
The pdf edition can be purchased at the following link:
https://www.valuentum.com/store/products/45
If you are interested in a paperback version, it is available at Amazon here. The second edition of the text can be accessed here.
The following is a link to a glossary of some common Valuentum terms found in our stock and dividend reports:
http://www.valuentum.com/articles/20110622_1
Do you have support that shows that the Valuentum Buying Index methodology was effective via simulation or backtesting? Do you have a white paper?
Yes. Download (pdf): "Value and Momentum Within Stocks, Too"
Here is a very important case study regarding the Valuentum Buying Index ratings:
https://www.valuentum.com/articles/20141003_1
Pasted below is the link to our white paper discussing the benefits of 'Valuentum' investing.
http://www.valuentum.com/articles/20120528
Here is more information:
https://www.valuentum.com/articles/20131026_1
https://www.valuentum.com/articles/20141009
Where can I find the current and previous editions of Valuentum’s Best Ideas Newsletter and Dividend Growth Newsletter? Also, where can I find the Nelson Exclusive archives?
Subscribers can view our newsletter archives at the following link:
Best Ideas Newsletter: http://www.valuentum.com/articles/20110927_1
Dividend Growth Newsletter: http://www.valuentum.com/articles/20170101
Exclusive Newsletter (website): https://valuentumexclusive.wixsite.com/home
The High Yield Dividend Newsletter is only delivered by email at this time. Archives are emailed periodically to members.
Why did the Valuentum Buying Index (VBI) rating change on my stock?
A stock’s Valuentum Buying Index rating is based on our view of the attractiveness of a company’s discounted cash-flow valuation, its relative valuation versus peers, and an overall technical/momentum assessment. If our views on any of these three investment pillars change, a company’s Valuentum Buying Index rating will change to reflect this new view. Download slide deck here (pdf). We use our methodologies and our experience and judgment to build the newsletter portfolios. Achieving the goals of the newsletter portfolios is our primary objective with our regular premium service.
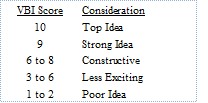
As it relates to the Best Ideas Newsletter portfolio, for example, if a stock registers a 9 or 10 on the Valuentum Buying Index in our coverage universe, we would consider adding it to the newsletter portfolio. When the stock then/eventually registers a 1 or 2 on the Valuentum Buying Index in time, we might then consider removing it from the newsletter portfolio. The changes in the "big middle" of the Valuentum Buying Index offer more tactical considerations, but we generally only consider the highest and lowest VBI ratings to be material. During times of market froth, however, as in arguably today's environment, in the Best Ideas Newsletter portfolio, we may relax some of the VBI criteria and consider undervalued stocks with neutral technical/momentum indicators, or fairly valued stocks with good relative valuation metrics and strong technical/momentum indicators. We may only consider removing ideas from the simulated newsletter portfolios when both their valuation and technical/momentum indicators point in the same direction (good/good or poor/poor), or if we're making more strategic/tactical moves.
The criteria for the Dividend Growth Newsletter is somewhat different. We're looking for strong dividend growth stocks in this simulated Dividend Growth Newsletter portfolio (something that is not a part of the criteria in the oBest Ideas Newsletter portfolio), meaning that in addition to considering the VBI and fair value estimate range, the Dividend Cushion is also very important. We still look to add highly-rated stocks on the VBI and those that are undervalued to this onewsletter portfolio, but we may be more open to ideas that have strong dividend growth prospects, on the basis of the forward-looking Dividend Cushion ratio. After adding ideas to this onewsletter portfolio, we may continue to include them in the portfolio even if they have modest VBI ratings that are trading within our fair value estimate range, as long as they have strong dividend growth prospects. We'd only consider removing a stock from the oDividend Growth Newsletter portfolio when we lose confidence in its intrinsic value support and its dividend growth prospects.
The way to think about our process is rather simple. In the Best Ideas Newsletter portfolio, if a company registers a high rating in our coverage universe, we consider adding it (but we won't consider adding all companies because of portfolio constraints). If we do decide to add the idea, then we watch its fair value estimate and technical/momentum indicators as it navigates the "big middle" of VBI ratings, and only consider removing the idea from the Best Ideas Newsletter portfolio if it registers a 1 or 2 on the Valuentum Buying Index. In the Dividend Growth Newsletter portfolio, we pay attention to the price-versus-fair value estimate range and the company's Dividend Cushion ratio, as we're looking for resilient equities with intrinsic-value support that have strong dividend growth prospects. Only when intrinsic-value support and dividend growth strength wane will we consider removing an idea from the Dividend Growth Newsletter portfolio.
Stocks included in the Best Ideas Newsletter portfolio and Dividend Growth Newsletter portfolio should be considered our best ideas at any given time, regardless of their Valuentum Buying Index ratings. Here is a helpful ranking below, but please note that we only use the VBI as a source of idea generation for further analysis. The ideas in the newsletter portfolios are always our best ideas at any given time.
How do I find stocks that meet my investment criteria?
Valuentum’s broad focus across investment methodologies (from value through momentum) allows us to provide subscribers with a variety of tools, metrics and screeners that are unique. Subscribers can access the available weekly stock screener on the left column of our website under the ‘Stock Screens’ category, or they can purchase our DataScreener, which contains sortable data and information on firms in our coverage universe. The larger DataScreener is included in our Gold Level membership services.
Where can I find the highest-quality stocks that Valuentum covers?
Our Best Ideas Newsletter portfolio may be a consideration: https://www.valuentum.com/categories/20121207
The Valuentum Exclusive publication may be interesting: https://www.valuentum.com/articles/20160505
Please learn about the Economic Castle rating here.
Our Ideas100 publication may also be worth a look. Please select the following link for more information:
http://www.valuentum.com/store/products/41
Where can I find stocks with the best dividend growth profiles?
Our Dividend Growth Newsletter portfolio may be a consideration: https://www.valuentum.com/categories/20121207
The Exclusive publication may be interesting for income-oriented investors: https://www.valuentum.com/articles/20160505
Please learn about the Dividend Cushion ratio here.
Our Dividend100 publication may be a consideration. Please select the following link for more information:
http://www.valuentum.com/store/products/38
How should an individual use the Valuentum Buying Index rating when they just start using this indicator as input on new positions? In other words, how does someone build their own portfolio? The VBI rating on the majority of the best ideas would not indicate a time to buy. For example, is "AIG" currently a better idea than "AAPL" for a new investor based on their VBI indicators?
There is clearly more going into the ideas then just VBI rating. The website indicates that the Best Ideas Newsletter portfolio contains the best ideas at any point in time, but the VBI rating on many of them would not indicate that someone should start a new position in them. I understand that portfolio management is a different topic then valuation, but I was interested to know how the Valuentum team would go about building a new portfolio if they were to start today.
As you mentioned, we primarily use the Valuentum Buying Index as a screening mechanism to surface new ideas for consideration. The rating is not absolute within the investment-decision making process, meaning that there are other factors beyond the rating that we consider before a company is added to the newsletter portfolios, the most important of which is approval from the Valuentum team (a precursor to adding the company to the newsletter portfolios). Our research indicates that the VBI rating is highly effective across large sample sets, but we take greater care when running the concentrated newsletter portfolios which target 15-20 holdings, not 500+ as in the published case study.
To your question in particular: "How should an individual use the VBI rating when they just start using this indicator as input on new positions?"
We're not aware of your personal goals or risk tolerances, so we don't have a basis for suggesting how you should build a portfolio, or phase into holdings over time. We can never give any personal financial advice in that regard. That said, we use the VBI as a screening mechanism to surface ideas we want to add to the existing simulated newsletter portfolios, to augment the existing positions in the newsletter portfolios in order to achieve the goals of both newsletter portfolios. We tend to add most 9s and 10s to the newsletter portfolios, but not all of them, and hold the ones that we add until they surpass fair value and begin to "roll over" from a technical standpoint, usually registering a 1 or 2 at that time.
We take a disciplined approach to new idea generation, so 9s and 10s don't come up too frequently. Apple is a holding in both newsletter portfolios, while AIG is not included, so we prefer the former despite its relatively lower VBI rating. The latter, however, is still highlighted as an idea, but it's just not for the Valuentum newsletter portfolios. Here's why: http://www.valuentum.com/articles/20120805.
There's a lot that goes into adding a company to the newsletter portfolios. Portfolio additions undergo a rigorous analyst-driven qualitative process, while the VBI rating is largely a quantitative output, though it, too, is driven by analyst expectations. The following goes into why we consider the holdings in the newsletter portfolios the best ideas at any given time, and why at times non-portfolio holdings can have higher weightings than portfolio holdings: http://www.valuentum.com/articles/20151026_1.
Also pasted below is another link as to how many members use our services, and the goals that we strive to achieve with respect to the newsletter portfolios:
http://www.valuentum.com/articles/How_to_Use_Valuentums_Investment_Services
If I am looking at a 1 or 2 month old Valuentum Buying Index, and the price and technicals have changed substantially, how useful is that Valuentum Buying Index rating? It just seems that the Valuentum Buying Index, for which price/fair value and technicals are factors, would require more frequent updates to be meaningful. Stocks that were overvalued at update time, that have corrected 10-15% (or more), surely have a different Valuentum Buying Index.
We could update the VBIs more frequently, but we think doing so only increases the likelihood of false technical/momentum signals (false breakouts, false breakdowns), which could "whipsaw" members. We're focused on the optimal signal-to-noise ratio.
We think the update cycle comes down to practicality, too. We emphasize analyst oversight with respect to our reports and rating system, as opposed to a fast-moving quantitative output, which would result in rapid changes in the VBI, and arguably make the VBI less meaningful (in the case it changes so much over such a short period of time).
Importantly, however, the VBI is just one aspect of our research, and we use it as a tool much like any other (the fair value estimate, the fair value range, Economic Castle, Dividend Cushion, the P/E ratio). The VBI question is not the easiest one to answer but we're working on triangulating on what makes the most sense for readers.
What is the most important measure of return on invested capital (ROIC), in Valuentum’s opinion?
We think return on new invested capital (RONIC) is the most important measure of whether a company is generating economic value for shareholders. Though we look at ROIC with goodwill and ROIC without goodwill (and each one is informative depending on a company’s acquisition program), we view the capacity of a company to generate economic value in the future (RONIC) as the best indication of its ability to translate such business performance into equity price outperformance, all else equal.
Read more about this in Value Trap.
How often does Valuentum make changes to its simulated newsletter portfolios held within the Best Ideas Newsletter and Dividend Growth Newsletter? What is the typical holding period for picks made?
The Best Ideas Newsletter portfolio and Dividend Growth Newsletter portfolio may be fully invested at times, and it may not make sense for us to add or remove a company each month. That's just not how we look at things. That said, we actively provide ongoing coverage of stocks and ETFs on our website and other ideas to consider in each monthly edition.
The holding period for stocks in the Best Ideas Newsletter portfolio and Dividend Growth Newsletter portfolio varies depending on the timing of when a particular stock converges to our fair value estimate. On average, however, we'd like to see an idea "work out" within a 12-24 month period, but many ideas have been in the newsletter portfolio for years, some for a half dozen or more.
To get a feel for the trading frequency and turnover of our portfolios, please view the transaction log of our Best Ideas Newsletter portfolio at the following link (login required):
http://www.valuentum.com/articles/20120509_1
If one is looking for one income idea, one capital appreciation idea, and one short idea consideration each month, the Exclusive may be worth considering:
https://www.valuentum.com/articles/20160505
What does Valuentum mean when it says it helps investors avoid value traps, falling knives, and the opportunity cost of buying a great stock at the most inopportune time?
Have you ever held an undervalued stock for years, and it hasn’t yet converged to what you think it is worth?
This is opportunity cost, and we think it is a real expense for investors. Because our process factors in a technical and momentum assessment after we evaluate its attractiveness via our valuation process, we think we're better able to pinpoint the best entry and exit points on stocks.
We also think we’re less likely to be involved in value traps because we demand material revenue and earnings growth for stocks to earn a 10 on the Valuentum Buying Index, and we think we’re less likely to be exposed to falling knives since our process requires firms to not only be undervalued but also be exhibiting bullish technicals before we would consider adding them to the Best Ideas Newsletter portfolio.
Research firms that just focus on valuation may encourage readers to buy a stock all the way down (a falling knife). As such, we think our process helps investors avoid the opportunity cost of buying a great stock at the most inopportune time.
Where can I directly find the 16-page stock reports on Valuentum's website?
The 'Symbol' search box in our website header is the best way to find our recent articles and analysis (as well as the 16-page equity and dividend reports) on companies of interest to you.
Pasted below is what the search box retrieves on information related to Intel (INTC), for example:
http://www.valuentum.com/search2?searchtext=intc&searchtype=symbol
A video on how to navigate our website can be found here.
Q: In the 16-page stock reports, why doesn't the 'percentage undervalued / overvalued' match up to the actual discount/premium to Valuentum's fair value estimate of the company?
A: We view the intrinsic value of a company as a Fair Value Range, not necessarily a single point estimate, so the undervalued and overvalued calculations match up to either the low fair value estimate or high fair value estimate, respectively. Within the context of a margin of safety, we wouldn’t necessarily view a company to be worth precisely $55 per share, for example; instead we'd view the company as worth between $50 (low end fair value estimate) and $60 per share (high end fair value estimate), with the low and high fair value estimates comprising the Fair Value Range in this hypothetical example.
We apply sensitivity analysis and scenario analysis with respect to a company’s future enterprise free cash flow stream to help inform the Fair Value Range of each stock, with the fair value estimate to be viewed as the most likely fair value estimate. As a result, the 'percentage undervalued / overvalued' is calculated by comparing the company's current price, as of the date of the report, with the low end and high end of its fair value range (not the single fair value point estimate), respectively.
If a stock's price falls below the low end of our fair value range, we'd view it as very cheap. If the stock price is above our fair value range, we think the company's shares are very expensive. If the stock falls within the fair value estimate range, we’d view it as fairly valued, though we still find valuable information in assessing the stock price’s relationship to the point fair value estimate, too.
As it relates to the percentage ‘Undervalued’ as shown in the case of Facebook’s report (dated December 3, 2021), specifically, the share price as of December 3 was $306.84, while the low end of its fair value estimate range as of the report date is $380 per share. Here is the calculation for the percentage ‘Undervalued’ in Facebook’s case, as shown in that report: [$380-$306.84]/$306.84 = 23.8%.
Q: I was wondering if you could provide more insight into Valuentum's ROIC calculations.
A: ROIC is the holy grail when it comes to assessing economic value creation!
Our ROIC calculation measures earnings before interest after taxes relative to the net operating assets of the firm. Some ROIC measures stick to GAAP data, but our measure is non-GAAP. We make a number of assumptions with respect to cash taxes in the numerator as in the process of enterprise valuation, and at times, adjustments to the denominator for entities with negative invested capital and others, which at times may impact the presentation of the ROIC percentage in the 16-page reports relative to our in-house valuation models.
For example, in some cases, we may exclude certain ‘Other Current Liabilities’ within our valuation model to arrive at a positive number in the denominator in order to reflect the economic substance of the business, where otherwise a great value-creating business would show a negative ROIC as the denominator would be negative because the business is very asset light. There may be additional ‘other assets’ (e.g. ‘Other Non Current Assets’) and ‘other liabilities’ that may be adjusted in our valuation model depending on analyst judgment on a case by case basis as each firm has different considerations. The goal of our ROIC calculation is to develop a metric to best reflect how to interpret the value-generating capacity of a business.
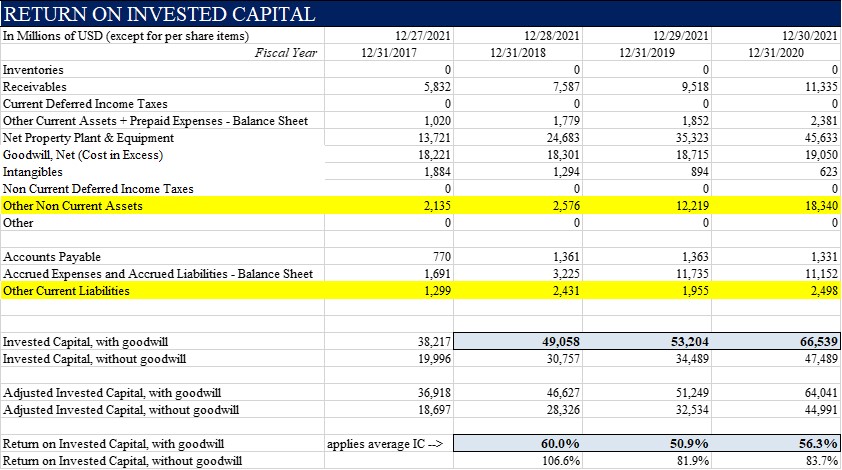
In the case of Facebook’s 16-page report, dated December 3, 2021, in particular, the ‘Invested Capital, with goodwill’ and ‘Invested Capital, without goodwill’ excludes both ‘Other Non Current Assets’ and ‘Other Current Liabilities’ within our valuation model, while the ‘Return on Invested Capital’ both with and without goodwill, as presented in the 16-page report excludes the ‘Other Current Liabilities’ line item as it uses a form of Adjusted Invested Capital in the denominator within the valuation model. Please note also that the Invested Capital in any ROIC calculation is the average of the past two years in the denominator.
As in the case of the Facebook example, these adjustments to our in-house valuation models can at times impact the presentation in the 16-page reports. The calculation to arrive at the 60.0% return on invested capital in 2018 for Facebook is as follows: {25,053/[36,918+46,627]/2} = 60.0%. To better explain these adjustments, we’ve included the following images to show how the data is transferred from our valuation infrastructure into the reports. The blue highlighted cells in the valuation model snippet (first image below) are the ones found in the 16-page report for Facebook, for example, while the yellow cells include areas where subjective analyst determinations are made whether to include or exclude “other’ items, among other line items, where appropriate.
In most cases, our analysts make a determination within the ‘Invested Capital’ calculation by assessing “Other Non Current Assets” and “Other Non-Current Liabilities,” among other adjustments. The ‘Invested Capital’ items shown in the 16-page report may exclude both of these items, as in the Facebook example, while the ‘Adjusted Invested Capital’ in the valuation model may exclude ‘Other Current Liabilities,’ among other adjustments, as in the case of Facebook. Though our team may not make such adjustments as these for all companies, there are certain instances where analytical adjustments are made to enhance the meaning behind the measure and to better reflect the economic substance of the business, most often with negative or low invested capital companies, but also with other companies such as Facebook.
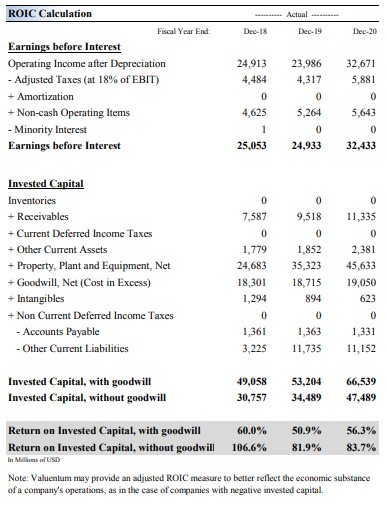
Modeling best practices often suggest to limit the impact of items where less insight can be gleaned, too (often, as in the case of ‘other assets and other liabilities’). We emphasize the occurrence of these unique circumstances in a note at the bottom of the ROIC calculation page in the 16-page report: “Note: Valuentum may provide an adjusted ROIC measure to better reflect the economic substance of a company's operations, as in the case of companies with negative invested capital.” We believe such adjustments are necessary for negative invested capital companies and help to augment the calculation in other cases.
Here is a snapshot of the valuation model (clarifications added) as well as the 16-page report of the ROIC calculation for Facebook.
From the model (clarifications added):
As translated into the report:
Download Facebook's report dated December 3, 2021 here (pdf) >>
Does a 'Very Poor' score on Valuentum's assessment of a company's dividend safety mean the firm will cut its dividend in future periods?
Not necessarily. In many cases, a 'Very Poor' dividend safety score will predict a cut, as this is what the Valuentum Dividend Cushion ratio has been designed to do.
However, in other cases, the Valuentum Dividend Cushion ratio may highlight significant risk related to future dividend payments (but not necessarily suggest that a cut is on the horizon). For one, the assessment of a company's dividend safety is based on the excess cash-flow capacity the firm has for future dividend raises after considering its balance sheet structure. By extension, there will be a positive correlation between the safety of a firm's dividend and its future potential for growth.
In other words, the larger the capacity the firm has to raise its dividend based on our Valuentum Dividend Cushion ratio, the more secure existing dividend payments are. However, just because a firm has a 'Very Poor' dividend safety score doesn't necessarily mean it will cut its dividend anytime soon. What a low safety score does mean, however, is that the board has effectively maxed out the company's annual payout and has little room for operating error.
In fact, a lot of steady-eddy utilities firms receive a 'Very Poor' safety rating. However, based on the stability of their business models (and sometimes fixed rate of returns), we're not expecting them to cut their respective dividends anytime soon. However, should an exogenous event happen, the board hasn't left much excess cash-flow capacity to absorb the impact and the dividend may be exposed to significant risk (think of the most recent examples of Exelon and First Energy).
More reading: Our Dividend Methodology...
What has been the "success rate" in your Best Ideas portfolio? What percentage of the names have outperformed? I want to make sure a few winners don’t account for “all” the alpha…
Out of the dozens or so ideas we have selected to include in the simulated Best Ideas Newsletter portfolio since inception (excluding options), many have outperformed the market. Stocks such as Visa, EDAC Tech and Apple have been significant sources of return for the simulated Best Ideas Newsletter portfolio, the latter two more-than-tripling and nearly doubling in price, respectively.
View the Best Ideas Newsletter archives here. Download an extensive analysis of the Best Ideas Newsletter portfolio here.
The performance of Nelson Exclusive ideas has also been great, with "success" rates from highlight price to 'close' price of ~75% through June 2017. Read more about the Exclusive here.
I have downloaded your last Best Ideas Newsletter and didn’t quite understand where to find your best ideas? There are several articles about firms not in your portfolio. Are these your ideas for buying or should I refer to the Best Ideas portfolio itself?
In the monthly Best Ideas Newsletter, we provide a wealth of information as it relates to our opinion of stocks in the news as well as a simulated portfolio of best ideas and a watch list of firms that score high on our Valuentum Buying Index. We use the Valuentum Buying Index as the primary criteria for adding or removing firms to or from the Best Ideas portfolio, respectively. Because the simulated portfolios have stringent oversight and a portfolio-management overlay, we may not add all companies that have high ratings on the Valuentum Buying Index to the portfolios due to diversification, cost, or broader-market considerations.
The goal of the Best Ideas Newsletter is to highlight ideas with strong capital appreciation potential and to update readers about new developments in the market. A portfolio of capital appreciation ideas is presented on page 8 of each edition. Within the newsletter portfolio, we strive to limit turnover and transaction costs, pursue diversification benefits, and engage in option strategies to capture our view on broader market trends or on individual ideas. In each edition of the Best Ideas Newsletter, we also include a watch list of firms to supplement the portfolio, as we understand that subscribers and clients may have different goals and varying investment mandates.
Our best ideas are the companies included in the newsletter portfolios (the Best Ideas Newsletter portfolio and Dividend Growth Newsletter portfolio), the Valuentum Exclusive publication, as well as the companies that score high on our Valuentum Buying Index. However, you should always consult your financial advisor to determine whether any investment in any security is suitable for you. At no time should any content on our website or in any transaction-alert email be viewed as a solicitation to buy or sell any security.
Why don't your VBI ratings change on a daily basis?
Investors can sell a stock for reasons unrelated to a company's fundamentals, and at times, make poor decisions on the basis of misinformation ("noise"), driving a firm's shares lower. In our view, it simply takes time to get an accurate read on any fundamental or technical changes of a company's stock. We want to deliver ideas with conviction and confidence and not alter our views on a firm on a daily or even weekly basis. We seek to target the optimal signal-to-noise ratio.
I am wondering about the difference in dividend increases for the current fiscal year between what is showing on your reports and what we believe are the actual increase numbers for some companies. Here are some examples: CL -- Valuentum shows 8.3%; actual increase on 3/6/14 was 5.8%. MDT -- Valuentum shows 7.7%; actual increase on 6/16/14 was 8.9%. CNI -- Valuentum shows 11.0%; actual increase on 1/30/2014 was 16.3% Any thoughts?
The reporting structure of the dividend payments in the dividend reports correspond to when the payments have been paid in previous historical years. So, for example, in CL's case, the company paid the following as dividends in 2013: $0.31, $0.34, $0.34, $0.34 = $1.33 (as shown in the report). The current year 'forecast' (2014) represents the annualized rate based on the current payout ($1.44 per share). The growth rate is then derived as such ($1.44/$1.33-1).
The future forecasts beyond the initial year converge to the following scale (in most cases):
Dividend Growth Potential
Excellent: 8% or higher
Good: 4%-8%
Poor: 2%-4%
Very Poor: 0%-2%
Please find an extensive read on how we derive our forecasts both in the discounted cash-flow models and with respect to dividend growth here.
Why do you use a risk free rate assumption of 4.25% when the current spot rate of the 10-year Treasury is about 2-3%?
In our discounted cash-flow models that we use to value every non-financial operating company in our coverage universe, we match the duration of future free cash flows (from year 1 to perpetuity) with expectations of the average discount rate over this forecast horizon (from year 1 to perpetuity). We think the best way to achieve expectations of the long-term future average rate of the 10-year Treasury (risk free rate) is to use the weighted average of the historical 10-year Treasury and the current spot rate. The goal of using a weighted average risk free rate in our DCF process is to achieve balance with respect to the duration of future cash flows.
For example, discounting a cash flow in Year 20 at the current spot rate doesn’t make much sense to us. Other methods consider the yield curve in discounting future free cash flows, or use a long-term average of the risk free rate without considering near-term changes in the 10-year Treasury rate. We think the use of the spot rate on the 10-year Treasury as the risk free rate in any valuation model would not only cause significant fair-value volatility but also result in a systematic overvaluation of companies relative to their true long-term intrinsic worth.
Why do you use such a wide fair value range for certain companies?
One of the most important concepts of the Valuentum methodology (and valuation in general) is the understanding that the value of a company is a range of probable valuation outcomes, not a single point estimate. Even well-seasoned stock analysts may fall into the trap of saying that a company's shares are worth exactly $25 or a firm's stock is worth exactly $100. The reality is that, in the first case, the company's shares are probably worth somewhere between $20 and $30, and in the latter case, the stock is worth somewhere between $75 and $125.
Why? Because all of the value of a company is generated in the future (future earnings and free cash flow), and the future is inherently unpredictable (unknowable). If the future could be predicted with absolute certainly (knowable), then a stock analyst could say a company's shares are worth precisely this, or that a firm's stock is worth precisely that. Not because he or she would know where the stock would be trading at, but because he or she would know precisely what future free cash flows would be (and all other modeling facts-not assumptions in this case) and arrive at the exact and non-debatable value of the firm.
But the truth of the matter is that nobody knows the future, and analysts can only estimate what a company's future free cash flow stream will look like. Certain unexpected factors will hurt that free cash flow stream relative to forecasts, while other unexpected factors will boost performance. That's how a downside fair value estimate and an upside fair value estimate is generated, or in the words of Warren Buffett and Benjamin Graham how a "margin of safety" is generated. Only the most likely scenario represents the point fair value estimate. Any stock analyst that says a company is worth a precise figure--whether it's $1 or $100--falls short of understanding one of the most important factors behind valuation.
But why the large range in many cases?
Well, there are many firms in our coverage universe that have a very large range of outcomes in their future free cash flow growth. And because discounting free cash flows is an integral part of calculating the fair value estimate of a company, the range of fair values will also be large. To illustrate this point, let's take a look at the difference between the levels of free cash flows in Year 20 under three different future growth rates: 10%, 15%, and 20%. Though the growth rate between each scenario is but 5 percentage points, the magnitude of the free cash flow difference is astounding many years into the future, and our discounted cash-flow process considers the long-term intrinsic value of firms.


We're scouring our coverage universe for firms that are trading outside of their respective fair value estimate ranges. A firm trading below the low end of its fair value range, for example, is undervalued, while a firm trading above its fair value range is overvalued. The fair value estimate range for each company captures the inherent uncertainty of the trajectory of that firm's unique future free cash flow stream. For the hundreds of companies we include in our coverage universe, we provide a discounted cash flow derived fair value estimate and a corresponding fair value range -- and a robust discounted cash-flow process is only one aspect of our service.
Read more about this in Value Trap.
In your probability distribution of fair values, how can a company actually have a non-zero probability of a negative fair value?
This is a great question because it hits on the myriad uses of Valuentum’s methodology. The non-zero probability is encircled in red below.
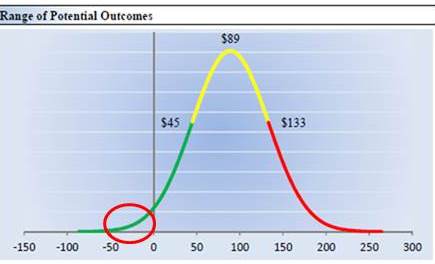
The way to interpret the area to the left of the $0 line (y-axis) is that it represents the probability of bankruptcy/insolvency of the firm based on the uncertainty of future expected free cash flows. Though there are specific values assigned to the area to the left of the $0 line (y-axis), they are arbitrary as any equity value below $0 is actually an event of default if liquidity dries up (eating into bondholders). So the small area underneath the green curve to left of the $0 line (y-axis) and down to the x-axis (which is a mapping of fair values) represents the probability of bankruptcy (default) given the firm's fundamental future cash flow profile and balance sheet leverage. We disclose the probability of bankruptcy/default of each company in our reports. Valuentum plans to eventually use these probability-of-default estimates to calculate a corporate credit rating for each entity.
At any point in time, I haven't found many stocks with VBI ratings of 9 or 10. Some stocks seem to have almost characteristically high VBI's. For sure, I should have immediately bought some names when you added them to the Best Ideas Newsletter when there VBI's were 9 or 10. However, after missing them upon their initial recommendation, I always had doubts as to whether they are still warranted as being highlighted as new investments after they have risen in price and their VBI's have fallen below 9 or 10. One suggestion: each month I wish you would highlight any stocks in the Best Ideas Newsletter portfolio you would buy NOW. Stocks added to the list as 9's or 10's now at 5, 6, or 7 may or may not be candidates for new investment just as all stocks with 9's or 10's are not added to the list for qualitative reasons.
First, please note that our ideas are just ideas, not recommendations. Please always consult your personal financial advisor that is aware of your individual goals and risk tolerances to see if any idea is right for you.
That said, your question comes up a lot. We've pondered having a special categorization of the VBI for best ideas in both newsletters portfolios but we haven't implemented it. For example, we've thought about changing the VBIs of newsletter portfolio holdings to 10+, but this would compromise our rating system.
At any time, whether a holding was added near inception or a holding is added two months from now, they are treated equally as new, interesting "best ideas." As we continue to emphasize in all of our writings, our best ideas for consideration at any time are included in the newsletter portfolios.
A portfolio manager must make a conscious decision to hold a stock every single day, and this conscious decision is reflected in it being one of his or her best ideas on a go-forward basis at that time. Only when it is removed from the portfolio is it no longer a best idea consideration.
Read more about this in Value Trap.
Here is much more on the topic:
http://www.valuentum.com/articles/How_to_Use_Valuentums_Investment_Services
Hope this helps explain how we think about our best ideas in building a portfolio!
Question regarding your ratings for dividend growth. I was checking out your recent list of stocks listed by Dividend Cushion ratio; you give many a dividend growth rating of "GOOD." However, with some of them, management has not seen fit to raise the dividend in a long time, and your own projection table at the right of the page projects flat dividend growth in future years, too. By your own records and this history, wouldn't this stock warrant a Dividend Growth rating of 'VERY POOR"? Interested in your response. Thanks.
This is a great question because it allows us to explain the layers embedded within our analysis, and what exactly the Dividend Cushion ratio measures, and what it doesn’t.
First, your question is probably more appropriately phrased as: Why are some companies Dividend Growth Potential rating GOOD (emphasis on “potential”), as it is the title that corresponds to the GOOD rating and what the rating applies to. In many ways, this answers your question: the Dividend Cushion ratio is strong, and therefore the company has tremendous potential to raise the dividend, but only if it so chooses.
In particular, the Dividend Cushion ratio measures the financial capacity of the company to keep raising the dividend in the future. It does not measure the board’s willingness to keep raising the dividend, which is another important consideration, something best expressed with an assessment of the company’s historical dividend track record.
Both capacity and willingness must be present to uncover the best dividend growth ideas for the coming years, in our view. That’s why many companies with strong Dividend Cushion ratios but poor track records, an unwillingness to raise the dividend, or have a small dividend yield don’t make the cut for the Dividend Growth Newsletter portfolio.
Perhaps most importantly, management and the board can do whatever they want with the dividend. We see cases all the time where a company puts up terrible performance and raises the dividend on hopes that investors will be satisfied with an increased payout that theoretically they already own. The Dividend Cushion ratio is a pure reflection of the financials used to assess the dividend growth potential of the company in the context of a firm’s balance sheet and future financial forecasts. It is not a measure of willingness. Sometimes the board stretches too much with the payout; sometimes the board falls short. The Dividend Cushion ratio is the yardstick that measures the dividend growth potential of each entity.
It perhaps goes without saying, however, that the Dividend Cushion ratio is not all that we provide with respect to dividend analysis. We publish our assessment of the company’s dividend track record, too, and we're doing tons more beyond the dividend analysis itself.
I'm a subscriber. I'm looking at your dividend report for Enterprise Product Partners (EPD). It says your Valuentum Dividend Cushion ratio for EPD is 2, but several lines below it says the unadjusted Dividend Cushion ratio is 0.25. Please explain the difference between the two ratios, and what is considered a good score for the unadjusted Dividend Cushion ratio, what is an excellent score, what is neutral and what is poor? Also, how much relative importance should I give to each score?
Also, further down in the section on unadjusted Dividend Cushion, the chart of EPD has a large negative number in the blue bar, and your text says: "Generally speaking, the greater the 'blue bar' to the right is in the positive, the more durable a company's dividend, and the greater the 'blue bar' to the right is in the negative, the less durable a company's dividend." So that means that EPD's dividend isn't durable, yet your report earlier says that EPD's Dividend Safety rating is GOOD. Can you elaborate?
Thank you for your question. It is a great one because it hits at the heart of the capital-market-dependency risk inherent to master limited partnerships (MLPs).
First, the raw, unadjusted Dividend Cushion ratio adds a company's net cash position to the sum of its future free cash flows (cash flow from operations less all capital spending) over the next five years and takes that sum and divides it by the sum of the company's expected cash dividends paid and growth in them over the next five years. The Dividend Cushion ratio is essentially a coverage ratio -- the higher the ratio above 1, the better able the company will be able to cover dividend payments in the future, in our view.
For most of our coverage and for most corporates, the qualitative ratings for safety and growth are a function of the raw, unadjusted Dividend Cushion ratio, as shown below.

For MLPs, REITs, and some utilities, however, we make modifications to the raw, unadjusted Dividend Cushion ratio in deriving the adjusted Dividend Cushion ratio. For example, with MLPs, we add back future expected equity issuance to the numerator and mitigate the company's debt load to a degree on account of assuming ongoing refinancing capacity for such entities. These adjustments result in a sharp upward revision to the raw, unadjusted Dividend Cushion ratio. For MLPs, REITs, and some utilities, we base the qualitative rating on this enhanced adjusted Dividend Cushion ratio, but we also disclose the raw, unadjusted Dividend Cushion ratio in each case.
In short, we believe both the raw, unadjusted Dividend Cushion ratio and the adjusted Dividend Cushion ratio offer insights. The former reveals the capital-market-dependency risks inherent to MLPs, for example, while the latter acknowledges that under benign market conditions, continued funding of the distribution/dividend would ensue. We place greater emphasis on the raw, unadjusted Dividend Cushion ratio because it is more of a pure risk measure than the adjusted one, which considers a variety of incremental funding sources, which cannot be guaranteed during difficult credit conditions.
Though we may make qualitative adjustments to the ratings themselves on account of other factors, the assigned breakpoints are as follows for both measures (they can be found on the definitions page in the Dividend report in the back):
Dividend Safety. We measure the safety of a firm's dividend by adding its net cash to our forecast of its future cash flows and divide that sum by our forecast of its future dividend payments. This process results in a ratio called the Dividend Cushion™. Scale: Above 2.75 = EXCELLENT; Between 1.25 and 2.75 = GOOD; Between 0.5 and 1.25 = POOR; Below 0.5 = VERY POOR.
Please let us know if we can elaborate further.
I don't understand why certain companies with very attractive Economic Castle ratings and Dividend Cushion ratios don't deserve a prominent place in the Valuentum portfolios.
This is a great question because it hits at the heart of the portfolio allocation decisions in managing the newsletter portfolios. We imagine that many members have similar questions about companies that they like, too: Why aren't they part of the newsletter portfolios?
Many companies in our coverage have fantastic businesses, strong Economic Castle ratings, and solid dividend coverage. Shares of these companies can also be undervalued, too, even if their Valuentum Buying Index ratings, which consider a 'market conviction' assessment through an evaluation of pricing strength, are not that great.
These companies are certainly top considerations. However, the primary reason why all of them are not included in the newsletter portfolios may have nothing to do with them at all, and everything to do with the opportunity cost of investing. In the case of a tech idea that fits this mold, for example, we're already quite tech-heavy in the newsletter portfolios, and it's difficult to argue with the fantastic performance of Apple and Microsoft the past few years. It just comes down to us liking other tech names better.
We're targeting the highest risk-adjusted return in the Best Ideas Newsletter portfolio, and that generally means that we can't include every company we like in the newsletter portfolios, mostly due to sector weighting exposure and/or that the next best idea usually isn't as good as the top idea. In all cases, however, we do our best to highlight good ideas that may not be in the newsletter portfolios via their attractive price-to-fair value estimate ratios, Economic Castle ratings, and Dividend Cushion ratios, and oftentimes, their better-than-average Valuentum Buying Index ratings.
As for fair value estimate changes and updates, they can occur for a number of reasons, but generally speaking, incremental news that impacts the near term may not have as great of an impact as news that may impact our long-term thesis and mid-cycle expectations. We comment frequently on companies in our coverage, and our fair value estimates are updated to reflect the ongoing evolution of our thoughts.
Here is more on what causes fair value changes >>
What is Value Trap: Theory of Universal Valuation?
It's Brian Nelson's new book!
Here's some more information on the text:
Wall Street doesn’t know it has a problem. Index and quantitative investors have been free-riding on the backs of active managers for years, but growth in price-agnostic trading may finally have reached the tipping point. Brian Nelson, former Director of Methodology at Morningstar and President of Investment Research at Valuentum, explains how enterprise valuation forms the Theory of Universal Valuation and why a focus on it may not only help you avoid value traps, but also save you from the next financial crisis. This is a 350 page book, including Preface, Notes, Bibliography and Index.
Download the electronic sell sheet here (pdf).
The text is a response to many worrisome trends and processes in the investment management business today. The book strives to answer the question: what is the appropriate empirical evidence in evidence-based finance? Surely, not just any empirical evidence will do. The book is not meant to be controversial, but a discussion of the great contradiction of “explaining” stock return behavior between factor-based investing (which is based mostly on ambiguous, realized data within in-sample sets) and the efficient markets hypothesis (which is based on expectations of future data, realized or not) may make it so.
The text is heavy in behavioral thinking and puts forth enterprise valuation as a behavioral framework in which to view stock prices and their movements. This book also shows how enterprise valuation is much more than a simple stock valuation tool, but rather that enterprise valuation is truly universal valuation, resting at the intersection of behavioral economics, quantitative theory, equity valuation, and therefore finance, itself. A reading of "The Data Dilemma and Valuentum Investing" in the Preface is necessary to understand the various types of data Nelson refers to frequently in this text: ambiguous, causal and impractical. Also emphasized in this book is the difference between in-sample, out-of-sample and walk-forward studies, the latter the author believes to be the most robust and authentic of processes.
In the first section of this book (chapters 1 through 3), Nelson welcomes you on a journey through the early lessons of his career and introduces some of the major shortcomings of traditional quant factor-based analysis, while building up the importance of a common theme in this text: the information contained in share prices. In the second section of this book (chapters 4 through 6), the causal nature of enterprise valuation to stock prices is explained, culminating in the Theory of Universal Valuation, which offers enterprise valuation as the central theme to quantitative value studies, efficient markets hypothesis testing and beyond. If at any time, it gets too theoretical, Nelson encourages the casual reader to skip ahead.
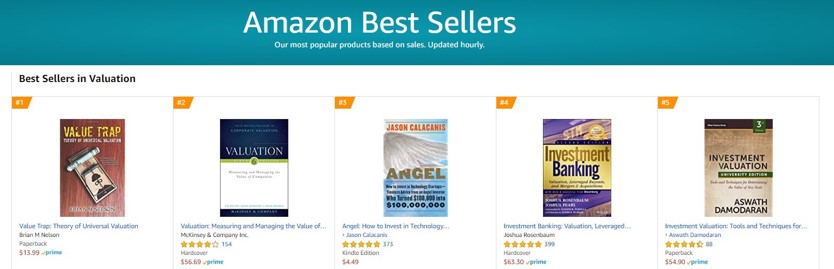
Image shown: In early January 2019, Value Trap was the #1 Best Seller in Valuation on Amazon.
In the final section of the book (chapters 7 through 10), Nelson talks about practical application of the principles explained in this text: how enterprise valuation can be used to identify bubbles and mispricings, how it’s valuable to dividend-growth and income frameworks, how it’s connected to economic moat and economic castle theory, and how it can be applied practically in an equity portfolio setting, as in Valuentum investing.
This book is not a how-to manual on how to perform enterprise valuation, or a get-rich-quick investment program, but rather a text that Nelson feels lays the foundation for a genuine conversation about stock investing, a conversation about price versus estimated intrinsic value. The book is chock-full of footnotes, too, offering greater depth in areas that may require it. This book is content-rich for the number of pages, as the author wants every sentence, every paragraph to be worth your while.
Mr. Nelson has over 15 years' experience in enterprise valuation and holds the Chartered Financial Analyst designation.
Order a paperback from Amazon: https://www.amazon.com/dp/0998038490
Download a digital pdf copy from the Valuentum store: https://www.valuentum.com/store/products/45
Valuentum is a financial publisher so why does it include ‘Securities’ in its corporate name?
It’s what we’re passionate about. We believe Security Analysis, in the spirit of Benjamin Graham and Warren Buffett, is of utmost importance to any investment consideration.
About Our Name
But how, you will ask, does one decide what [stocks are] "attractive"? Most analysts feel they must choose between two approaches customarily thought to be in opposition: "value" and "growth,"...We view that as fuzzy thinking...Growth is always a component of value [and] the very term "value investing" is redundant.
-- Warren Buffett, Berkshire Hathaway annual report, 1992
At Valuentum, we take Buffett's thoughts one step further. We think the best opportunities arise from an understanding of a variety of investing disciplines in order to identify the most attractive stocks at any given time. Valuentum therefore analyzes each stock across a wide spectrum of philosophies, from deep value through momentum investing. And a combination of the two approaches found on each side of the spectrum (value/momentum) in a name couldn't be more representative of what our analysts do here; hence, we're called Valuentum.
--------------------
Past results are not a guarantee of future performance. The High Yield Dividend Newsletter portfolio, Best Ideas Newsletter portfolio, ESG Newsletter portfolio, and Dividend Growth Newsletter portfolio are not real money portfolios. Any performance, including that in the Nelson Exclusive publication, is hypothetical and does not represent actual trading. Valuentum is an investment research publishing company.