
Member LoginDividend CushionValue Trap
|
A Note on Valuation -- Low P/E Stocks with High Dividend Yields
publication date: Dec 1, 2023
|
author/source: Brian Nelson, CFA
“But carrying low valuation parameters is far from synonymous with “underpriced.” It’s easy to be seduced by the former, but a stock with a low p/e ratio, for example, is likely to be a bargain only if its current earnings and recent earnings growth are indicative of the future. Just pursuing low valuation metrics can lead you to so-called “value traps”: things that look cheap on the numbers but aren’t, because they have operating weaknesses or because the sales and earnings creating those valuations can’t be replicated in the future.” – Howard Marks, Something of Value (2021) By Brian Nelson, CFA I was reminded of Howard Marks’ 2021 memo, “Something of Value,” after a few readers expressed interest in low P/E stocks with high dividend yields. We’ve written about the topic of “value traps” extensively in our book Value Trap, using “quantitative value” as the example for the types of stocks that have such characteristics: those with low P/B ratios, low P/E ratios, or another low valuation multiple, exclusive of an assessment of the absolute price-to-fair value estimate ratio via the discounted cash-flow method. Perhaps needless to say if you’ve been reading my work the past several years, groupings of stocks with low valuation multiple parameters have significantly trailed the broader S&P 500 return for a long time and by a meaningful margin.
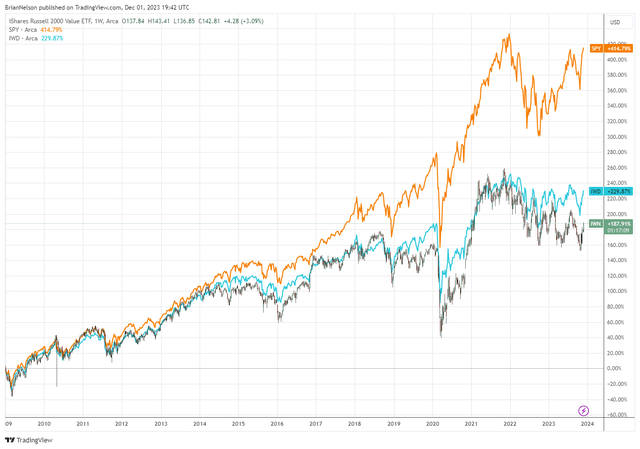
Image: Stocks with low valuation multiples have trailed the broader S&P 500 (orange) considerably since the depths of the Great Financial Crisis. But why? In Marks’ 2021 memo, he states that “if something carries a low valuation, there’s probably a good reason,” and we think this statement is worth emphasizing. A low P/E ratio, for example, doesn’t consider a company’s balance sheet in the calculation. Typically, stocks with huge net debt positions should trade at low valuation multiples because net debt is a subtraction to the present value of their future expected free cash flow, resulting in depressed equity values relative to earnings. AT&T (T) and Verizon (VZ) are probably the best examples to illustrate this dynamic. Both entities hold a massive amount of net debt on their books and are trading at single-digit forward P/E ratios. These low P/E ratios, in AT&T’s and Verizon’s cases, however, are largely a reflection of their net-debt heavy balance sheets and should not be extended to believe that their stocks are cheap. In fact, both AT&T and Verizon are fairly valued based on our discounted cash flow process. A couple of other stocks sporting a single-digit P/E ratio and a hefty net debt position on their respective balance sheets are Walgreens Boots Alliance (WBA) and Whirlpool (WHR). Both entities have seen better days, as Walgreens recently issued a lower-than-expected outlook for fiscal 2024 adjusted earnings and Whirlpool offered a full-year 2023 earnings target below consensus estimates. In these cases, earnings growth is under pressure, a dynamic when considered with their net-debt heavy balance sheets further supports the low P/E ratios they garner. Another commonality of Verizon, AT&T, Walgreens Boots Alliance and Whirlpool is that they all have above-average dividend yields. The reason for this is similar to the reason for their low P/E ratios. Equity value is depressed within the discounted cash-flow construct because of their net debt positions, and after dividing their respective dividends by their respective depressed equity values, it results in a comparatively high dividend yield. Companies with low P/E ratios and high dividend yields may seem attractive at face value, but enterprise valuation often says otherwise. Now let’s provide an example illustrating where a company with a low P/E ratio and decent dividend yield may be a good idea. For this, let’s use simulated Dividend Growth Newsletter portfolio holding Dick’s Sporting Goods (DKS). Dick’s Sporting Goods has a P/E ratio that is hovering around ~10 times forward expected earnings, and it holds roughly a net neutral balance sheet position (it does have debt-like commitments in operating leases, however). Our fair value estimate of Dick’s Sporting Goods stands at $165 per share, well above where shares are currently trading. In this case, Dick’s Sporting Goods’ shares look cheap to us while it pays a nice ~3% dividend yield to boot. We believe that the cash components of intrinsic value -- net cash on the balance sheet and future expectations of free cash flow -- help to provide the reason for why a stock trades at a particular valuation multiple. If a stock has a net cash position and generates material recurring free cash flow growth, it should garner a high P/E ratio from the market. If, on the other hand, it has a net debt position and is generating meager cyclical free cash flow, it should garner a low P/E ratio from the market. It’s not the absolute level of the P/E that matters, but rather whether a stock should be trading at a higher or lower one than what is observed in the market based on its cash-flow derived intrinsic value estimate. P/E ratios, by themselves, can be very misleading when it comes to the value assessment. Concluding Thoughts
Today, with all the readily available information and data out there, it is far more likely the case that a company with a low P/E ratio actually deserves it, and a firm with an outsized dividend yield just holds a lot of net debt on their books. Investing in low P/E stocks or stocks with low valuation multiples without considering their intrinsic values (i.e. fair value estimates) may result in just owning a basket of value traps. Investors may be attracted to these types of stocks for their low P/E ratios and hefty dividend yields, but just having a low P/E ratio and a high dividend yield doesn’t a good stock make. If investing were this easy, so-called “value stocks” wouldn’t have underperformed the market significantly for more than a decade and a half now. ---------- It's Here!
The Second Edition of Value Trap! Order today!
 -----
Brian Nelson owns shares in SPY, SCHG, QQQ, DIA, VOT, BITO, RSP, and IWM. Valuentum owns SPY, SCHG, QQQ, VOO, and DIA. Brian Nelson's household owns shares in HON, DIS, HAS, NKE, DIA, RSP, SCHG, QQQ, and VOO. Some of the other securities written about in this article may be included in Valuentum's simulated newsletter portfolios. Contact Valuentum for more information about its editorial policies. Valuentum members have access to our 16-page stock reports, Valuentum Buying Index ratings, Dividend Cushion ratios, fair value estimates and ranges, dividend reports and more. Not a member? Subscribe today. The first 14 days are free. |


0 Comments Posted Leave a comment