
Member LoginDividend CushionValue Trap
|
About the Fair Value Range
publication date: Oct 4, 2016
|
author/source: Valuentum Analysts
Understanding the Fair Value Range and Why It's Important
FAQ: Why do you use such a wide fair value range for certain companies?
One of the most important concepts of the Valuentum methodology (and valuation in general) is the understanding that the value of a company is a range of probable valuation outcomes, not a single point estimate. Even well-seasoned stock analysts are guilty of saying that a company's shares are worth exactly $25 or a firm's stock is worth exactly $100. The reality is that, in the first case, the company's shares are probably worth somewhere between $20 and $30, and in the latter case, the stock is worth somewhere between $75 and $125.
Why? Because all of the value of a company is generated in the future (future earnings and free cash flow), and the future is inherently unpredictable (unknowable). If the future could be predicted with absolute certainly (knowable), then a stock analyst could say a company's shares are worth precisely this, or that a firm's stock is worth precisely that. Not because he or she would know where the stock would be trading at, but because he or she would know precisely what future free cash flows would be (and all other modeling facts-not assumptions in this case) and arrive at the exact and non-debatable value of the firm.
But the truth of the matter is that nobody knows the future, and analysts can only estimate what a company's future free cash flow stream will look like. Certain unexpected factors will hurt that free cash flow stream relative to forecasts, while other unexpected factors will boost performance. That's how a downside fair value estimate and an upside fair value estimate is generated, or in the words of Warren Buffett and Benjamin Graham how a "margin of safety" is generated. Only the most likely scenario represents the point fair value estimate. Any stock analyst that says a company is worth a precise figure--whether it's $1 or $100--falls short of understanding one of the most important factors behind valuation.
But why the large range in many cases?
Well, there are many firms in our coverage universe that have a very large range of outcomes in their future free cash flow growth. And because discounting free cash flows is an integral part of calculating the fair value estimate of a company, the range of fair values will also be large. To illustrate this point, let's take a look at the difference between the levels of free cash flows in Year 20 under three different future growth rates: 10%, 15%, and 20%. Though the growth rate between each scenario is but 5 percentage points, the magnitude of the free cash flow difference is astounding many years into the future, and our discounted cash-flow process considers the long-term intrinsic value of firms.
 Under these future free-cash-flow scenarios, if we assume an 8% discount rate and 100,000 shares outstanding (and no debt), the difference in the fair value estimate between the upside case (green line) and downside case (blue line) would be an incredible $68 per share ($82 per share less $14 per share). That's a huge fair value range (80%+), and all because of just a 10 percentage point difference in a future free cash flow growth assumption. For firms that are growing cash flows at 200% or 300% per annum, a large range of fair value outcomes is not only inevitable but also very reasonable. In other words, the Valuentum framework provides an avenue to quantify the upside and downside risks investors are taking in high uncertainty and fast-growing enterprises.
 Image Source: LinkedIn
To really hit this point home, shown above is a slide of LinkedIn's (LNKD) revenue from the first quarter of 2010 through the first quarter of 2013. The green line (mapped to the right axis) shows LinkedIn's revenue growth rate. Let's assume revenue expansion translates into similar free cash flow growth expectations (not exactly a precise assumption, given the leverage in LinkedIn's business model), but bear with us for simplistic illustrative purposes. Will LinkedIn's revenue/cash flows expand at a 20% rate, a 40% rate, or a 60% rate (or an even greater pace) through year 20?
It's a very, very difficult question to answer. Remember how significant that 10 percentage point spread was in the hypothetical example above? Well, it's even more significant for LinkedIn. We know LinkedIn's free cash flows will expand, and expand fast, but just how fast is certainly debatable. To a very large extent, that's why LinkedIn's range of probable outcomes (fair value range) is so large. Understanding the cone of fair value outcomes of a company is helpful because the size of the range tends to be positively correlated to the equity's volatility. If you recall, look at what happened to LinkedIn's stock recently when investors ratcheted down their long-term growth assumptions (and by extension, the company's intrinsic value).
Shares collapsed in a huge way.
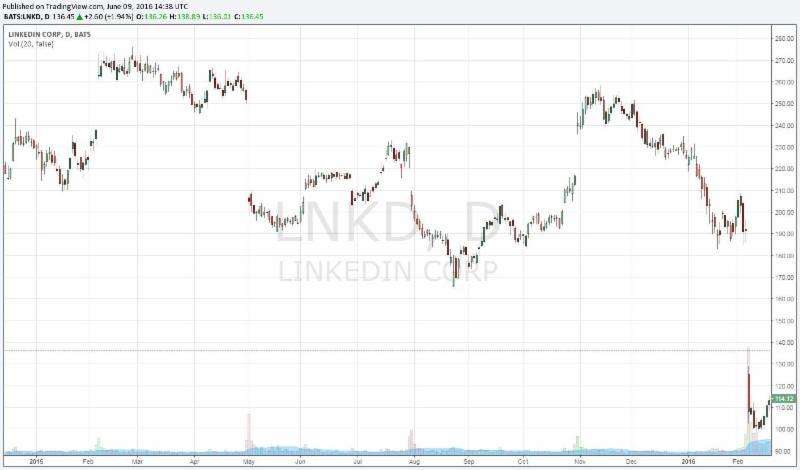 But it was largely because of that same weakness in equity pricing that drove Microsoft (MSFT) to take the leap to buy LinkedIn's equity outright just a few months later. Over just a very short period of time, LinkedIn's shares effectively collapsed and then surged as the chart below shows (its intrinsic value range didn't change much, however). Having a fair value range that adequately captures both the upside and downside cases for a company's shares remains an integral part of stock investing. Not only does it help hone in on the potential risk-reward profile of an equity at any given time, it also helps reveal the attractiveness of various "entry" or "exit" points using a robust free-cash-flow based and fundamentally-sound intrinsic value estimate as the anchor.
 We're scouring our coverage universe for firms that are trading outside of their respective fair value ranges. A firm trading below the low end of its fair value range, for example, is undervalued, while a firm trading above its fair value range is overvalued. The fair value range for each company captures the inherent uncertainty of the trajectory of that firm's unique future free cash flow stream. For the 1,000+ companies we include in our coverage universe, we provide a discounted cash flow derived fair value estimate and a corresponding fair value range -- and a robust discounted cash-flow process is only one aspect of our service.
-
Read about the importance of fair value estimates, "How Well Do Enterprise-Cash-Flow-Derived Fair Value Estimates Predict Future Stock Prices? -- And Thoughts on Behavioral Valuation."
|

