Member LoginDividend CushionValue Trap
|
Valuentum's Performance on Seeking Alpha
publication date: Oct 9, 2014
|
author/source: Valuentum Editorial Staff
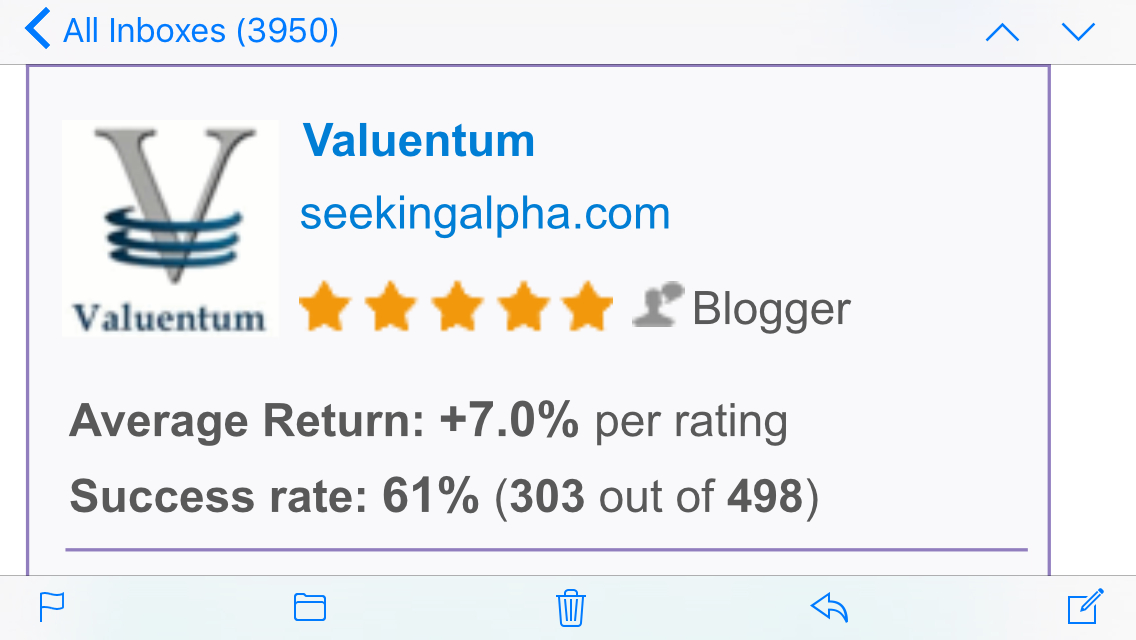
Image Source: TipRanks, as of November 2016 By Valuentum Editorial Staff Seeking Alpha recently published the returns of certain 'buy' and 'sell' calls for each author. We applaud the firm's ongoing dedication to transparency of its authors, if not by name, by track record. Valuentum Securities is an independent research firm headed by President Brian Nelson, CFA. Out of the 2,000+ articles Valuentum has published on Seeking Alpha, the Seeking Alpha study covered 567 of them, spanning from May 16, 2011, through June 25, 2014. Long ideas: 508; short ideas: 59. The articles in the study spanned all sectors and market capitalizations. The study pulled articles that were either tagged by Valuentum as 'long' ideas or 'short' ideas within the writer interface. The study also included articles on the same company published at multiple times during the time period, whether as a long idea or short idea or both. Valuentum was neither aware of the significance of tagging ideas as either long or short ideas at the time the article was published on Seeking Alpha, or the time horizon at which the study would measure, over a 3-month, 6-month, and 1-year period after publishing. Valuentum did not view the tagging mechanism within the Seeking Alpha interface as a submission of a long or short idea, as most submissions focus more on research and analysis. Said differently, there may have been significantly more or significantly less 'long' or 'short' ideas submitted if Valuentum had known the significance of the tagging prior to the study. The Seeking Alpha study--though not taking into consideration all of Valuentum's articles published on Seeking Alpha, or the Valuentum Buying Index rating or Valuentum's fair value estimates in the article--may still be helpful for readers in getting to know Valuentum and its track record. For example, there may be some readers that only follow Valuentum periodically for its free submissions on Seeking Alpha and have not subscribed to the comprehensive research on the website, which aggregates real-time charting functionality, the comprehensive 16-page company report, recent article commentary, and dividend reports, where applicable. According to Seeking Alpha, the total return of long and short ideas was calculated using the first available closing price after the article was published. The measurement did not take into account the author's price target (or fair value estimate in Valuentum's case) or time frame (roughly 18-24 months in Valuentum's case). Seeking Alpha encourages readers to evaluate the articles in the study to clarify the author's intentions. Valuentum, for example, does not advocate shorting at all, so the study is for exploratory purposes. Results Valuentum is one of the most published authors on Seeking Alpha with one of the largest coverage universes. We're not aware of any other author that has published a larger number of articles across a larger range of companies on the Seeking Alpha platform. The breadth of coverage and 'randomness of articles selected' via the tagging mechanism speaks to an independent and significant study, albeit an incomplete one. In the study, 'tagged long ideas' averaged a 3.6%, 7.3%, and 18.6% return over the immediate 3-month, 6-month, and 12-month periods following publication.
In the study, 'tagged short ideas' averaged a -1.8% (negative 1.8%), 2.4% and 21.9% return over the immediate 3-month, 6-month, and 12-month periods following publication. Importantly, the 3-month average showcased a negative return over an immediate 3-month period.
In the study, the long-less-short average was 5.4 percentage points, 4.9 percentage points, and -3.2 percentage points over the immediate 3-month, 6-month, and 12-month periods following publication. The positive difference between the 3-month and 6-month periods reveals that 'tagged long ideas' outperformed 'tagged short ideas' over the respective time period. The 3-month average has the largest number of data points in the study, and we point to those results as being the most significant.
We believe a positive gap would be achieved for the 12-month average under different measurement criteria, though such analysis is beyond the scope of the article. For example, this linked article about Radio Shack (RSH) on October 1, 2012, hurt short performance by contributing a positive 45% return to the 12-month average in the study. As of today, the article's short contribution would be a negative 67% (-67%), as Radio Shack continues to struggle. Also, perhaps Valuentum's three best (and most controversial) 'short calls' published on Seeking Alpha in Seadrill (SDRL) here, American Capital (AGNC) here, and Arena Pharma (ARNA) here were not included in the study. These examples speak to the limitations of the study. Further, the time period of the study covered a very strong bull market, where overpriced stocks became more overpriced. Companies that contributed to the discrepancy on the short side in the 12-month average included Sprint (S), Choice Hotels (CHH), Boston Beer (SAM), Lennar (LEN), First Solar (FSLR), LinkedIn (LNKD), and Citigroup (C). We do not consider these firms high-quality entities, and we do not advocating shorting them or any stock, for that matter. Though there are clearly limitations to the study, we do note that low-VBI-rated (poorly rated) stocks performed slightly better-than-expected during a concurrent and different trailing 12-month study of the Valuentum Buying Index (link provided later in article). The strong bull market has been particularly difficult for investors purely focused on shorting stocks. As followers of Valuentum know, the Valuentum Buying Index is not particularly designed as a short strategy. To increase efficacy, a forensic accounting, secular product evaluation, and liquidity and solvency analytical overlay to the VBI would be preferred. Valuentum may roll out a customized short strategy and portfolio in the future. Takeaways The Seeking Alpha study hints at the strong positive returns of high-VBI rated long ideas and weak (and sometimes negative) returns of low-VBI rated short ideas. We presented the results of the study with no modification or adjustments, as we believe this may be the best way to present the performance, in the spirit of transparency and independence. Though there are certainly limitations of the Seeking Alpha study, this performance also speaks to the sentiment readers may have on Valuentum's stock-selection ability, which we view as significantly positive. For the purest measure of Valuentum's performance and the Valuentum Buying Index system in action, please view the performance of the Best Ideas portfolio. We also encourage readers to learn more about the Valuentum Buying Index rating system via the concurrent trailing 12-month study, results revealed here. Thank you for reading! Data pulled October 5, 2014. |
|||||||||||||||||||||||||||