Member LoginDividend CushionValue Trap
|
What Causes Fair Value Estimates to Change?
publication date: Apr 29, 2025
|
author/source: Brian Nelson, CFA
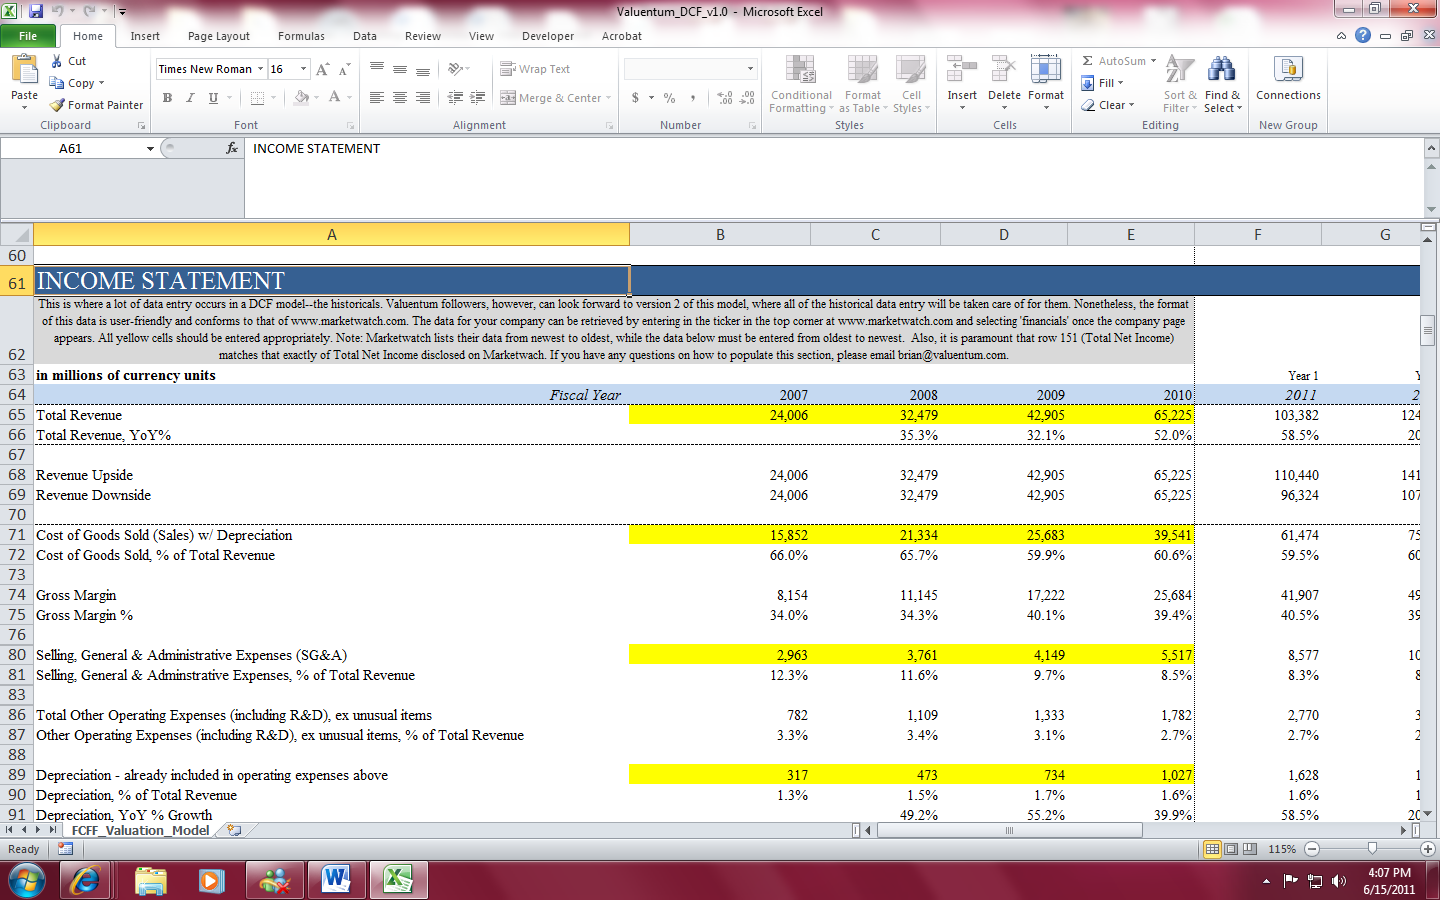
Image: A screenshot of the discounted cash-flow model learning tool for individual investors. By Brian Nelson, CFA If you’ve been a member of Valuentum for a while, you’ll notice that when we update a stock report, our estimate of a company’s fair value and the firm’s Valuentum Buying Index ratings can change. This is completely normal and should be expected (over time, companies generate cash and stock prices change). But sometimes the changes can be confusing, particularly if they are material (i.e. 10%, 20%, or more). In this article, let’s talk about why changes are standard operating procedure for investment research publishers. First, some background. Our estimate of a company’s fair value is driven by myriad factors. To derive a company’s fair value estimate, we use a detailed cash flow model that considers future expectations of revenue, earnings and cash flows, among other financials (i.e. the balance sheet). When important drivers of valuation change or when new information comes to light, fair value estimates can, should and do change. Though there are perhaps an infinite number of reasons why a fair value estimate can change, there are two primary reasons that account for the vast majority of revisions. Rolling the Model Forward The biggest fair value revision generally occurs when “we roll a company’s model” forward one year. This is "analyst speak" for when Year 1 of the model changes from, say, 2015 to 2016, or in the case of what will happen this year, from 2024 to 2025. The timing of this revision occurs after a firm issues its fiscal annual report (Form 10-K or Form 20-F). For most companies, this occurs late in the first quarter, and our updating proceeds through the second and third calendar quarters. Once we receive the audited new information for the last fiscal year (which is released in the Form 10-K or Form 20-F), the new data is entered into the valuation model. This is why you may see last year's data still listed as Year 1 through most of the first or second quarters of any year. We're still waiting for the clean, audited numbers. Generally speaking, if our forecasts are accurate, a company’s fair value estimate should increase by its discount rate less the dividend yield each year, all else equal. However, this increase almost never happens in practice, as the trajectory of the firm’s future free cash flow stream and its capital structure are refined with the new information in the Form 10-K or Form 20-F. For example, if a company has engaged in value-destructive activities during the previous year (e.g. it has overpaid for acquisitions and bought back its own stock at egregious prices), this will show up in the new fair value estimate. On the other hand, if a firm is a wise capital allocator, the firm’s balance sheet and future cash flow trajectory will have been enhanced from the previous year, and this would cause an upward revision in the fair value estimate (sometimes by 10% or more), all else equal. When “rolling the model forward,” there are a near-infinite number of drivers that could influence the fair value estimate, though we point to changes in the balance sheet (specifically the net cash/debt position) and changes in the future free cash flow stream (revenue, EBI, capital spending, working capital and other components) as being the two biggest factors. Most of the drivers behind a change in a fair value estimate, resulting from when “we roll the model,” will be operational (e.g. updating the cash flow trajectory and accounting for cash generated during the previous year as reflected in the updated balance sheet and/or lower share count). We tend not to adjust a firm’s cost of equity, nor do we adjust the risk-free rate frequently, though this may happen in some cases. Note: Our valuation model does not account for cash generated in interim model updates during the year. For simplicity, we account for cash generated during the previous year once, at the time we “roll the model”-- not continuously. Significant Changes in Expectations or Transformative Acquisitions Valuentum’s fair value estimates, and by extension, the Valuentum Buying Index (VBI) rating are forward looking. That means when expectations of a company’s future free cash flow stream are revised as a result of forward guidance revisions (or incremental insight from our analyst team), or when a company pursues a transformative acquisition that will materially change its capital structure in the future, the fair value estimate changes accordingly. The reason is that a company's pro forma balance sheet and future free cash flow assumptions have changed. The variables that cause the biggest change in the fair value estimate on an operating level are our forecasts of a company’s mid-cycle operating margin (Year 5) expectations, mid-cycle (Year 5) revenue growth rate, and capital spending over the 5-year discrete forecast period (or phase I of the model). In more general cases, if firm XYZ comes out with substantially lower revenue and earnings guidance for Year 1 than what we had been modeling, there may be a downward revision in the company’s fair value estimate, all else equal, but it won't be as large as revisions driven by changes in mid-cycle expectations. Though changes in Year 1 (or even Year 2) assumptions in the valuation model do not impact the fair value estimate materially in most cases, the information behind the revised guidance could still influence the intermediate-term and even the long-term forecasts of the model (think 'avalanche' or 'cascade' effect), and this would cause an even larger fair value estimate revision than what might have been expected by the minor near-term changes (in some cases). Whenever the trajectory of the future expected free cash flow stream changes, the fair value estimate, which is based on the future free cash flows, changes, too. This is a fact of the value calculation. How to Think About All of This First of all, we are not a quant firm. What you see in our reports is in-depth fundamental financial analysis. Analysts from investment bankers to sell-side brokerage firms use a discounted cash-flow model. Their results may be presented in the form of a valuation multiple, but every merger or business transaction is generally backed by a pro-forma discounted cash flow model that justifies the transaction multiple. Conversely, the multiple implicitly considers all of the information in a discounted cash-flow model. Even a P/E multiple applied to this year’s earnings has an implied growth rate for earnings 10, 15, 30 years…into the future. Thinking about the long-term in valuation is inescapable, and the discounted cash-flow model is the best way to think about the long term. Second, we don’t just hit a button and the published fair value estimate pops out of the valuation model. Though we understand that being roughly right is better than being precisely wrong (think in the context of Warren Buffett's margin of safety), we spend a tremendous amount of time modeling companies. We don’t play the near-term earnings estimate game, however. For one, because most of a company's value comes from long-term assumptions beyond Year 5, we have little interest in competing with the dozens or so sell-side analysts that cover the average S&P 500 company these days. That means our near-term forecasts don’t differ much from management’s guidance, or consensus for that matter. On average, our revenue and earnings estimates for the next two years won’t be but a couple percentage points away from consensus estimates. So If We're Not Playing The Earnings Game, What's Our Advantage? We think our advantage rests in our modeling experience and synthesizing the framework down to a few key drivers within the detailed free cash flow valuation model that we think Wall Street often gets wrong (namely mid-cycle operating margins and mid-cycle revenue growth). Whereas Wall Street spends most of its time playing the quarterly earnings game, we’re instead focused on nailing our mid-cycle forecasts and getting the company’s fair value estimate correct. As noted before, almost all of a company’s intrinsic value is based on the structure of its balance sheet (i.e. net cash position) and its future expected normalized free cash flow stream, not on next quarter’s earnings. We understand that there may be a 10%-20% revision or more in a company’s fair value estimate at times, but this is normal in the world of value estimation (expectations of the future are always changing and sometimes materially). You can always view the ‘Valuation’ page in a company’s 16-page report to see exactly what forecasts have changed from the previous report (page 5 gives you a very nice summary of the three stages of the model). In almost all cases, the updated fair value estimate will fall within the previous report’s fair value estimate range. At the very core of valuation, however, is the concept of Benjamin Graham's margin of safety, and we consider stocks to be truly undervalued (or overvalued) when their share price is trading below (or above) the low (or high) end of the fair value estimate range, respectively. With that said, at times we may add stocks to the newsletter portfolios that are trading at less of a discount that we may desire, as sometimes the very best companies with the strongest business models hardly ever trade at bargain-basement prices. In the 16-page stock reports, the percentage difference from the company’s share price to the low end of the fair value range (if it is trading below the low end) is considered the ‘percentage undervalued,’ and the percentage difference from the company’s share price to the high end of the fair value range is considered the ‘percentage overvalued’ (if it is trading above the high end). The very best way to get a feel for all the moving parts of stock valuation is to take a discounted cash-flow (enterprise) valuation model for a test spin. You don’t have to become an expert on the discounted cash-flow (enterprise) valuation process to do well -- just thinking about the key variables behind a discounted cash-flow valuation model will make you a better investor, in our view. In doing so, you'll also learn about all the pitfalls of using simple valuation multiple analysis. We hope you’ve found this article informative, and if you have any questions about any aspect of our research, please don’t hesitate to reach out to our team at info@valuentum.com. Thank you for reading! ---------- It's Here!
The Second Edition of Value Trap! Order today!
 -----
Tickerized for various disruptive innovation companies. A version of this article appeared on the website June 27, 2014. Brian Nelson owns shares in SPY, SCHG, QQQ, QQQM, DIA, VOT, RSP, and IWM. Valuentum owns SPY, SCHG, QQQ, QQQM, VOO, and DIA. Brian Nelson's household owns shares in HON, DIS, HAS, NKE, DIA, RSP, SCHG, QQQ, QQQM, and VOO. Some of the other securities written about in this article may be included in Valuentum's simulated newsletter portfolios. Contact Valuentum for more information about its editorial policies. Valuentum members have access to our 16-page stock reports, Valuentum Buying Index ratings, Dividend Cushion ratios, fair value estimates and ranges, dividend reports and more. Not a member? Subscribe today. The first 14 days are free. |