Market-Cap Weighted S&P 500 Breaks Out; Have We Already Seen the Bottom?
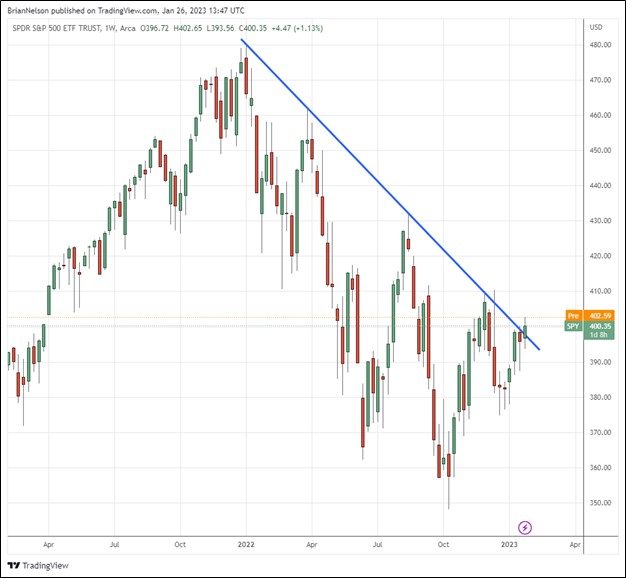
Image: The market-cap weighted S&P 500 (SPY) has broken through its downtrend. The markets could be headed meaningfully higher. Image Source: TradingView
By Brian Nelson CFA
Excess savings in consumer bank accounts from the pandemic stimulus and government intervention that was issued during the worst of the COVID-19 pandemic will start to deplete almost entirely by the middle of this year. Talk of the debt ceiling on the U.S.’s national debt of $31.5 trillion is emerging, and interest on the debt will start to crowd out other spending with respect to the national budget.
The markets, however, are forward looking, and many of these concerns are largely “baked in.” Within the discounted cash-flow model, for example, we take into consideration the nature of the economic cycle and generally target mid-cycle expectations on a run-rate, going-concern basis, so a looming recession, in simplistic sense, should not have too large of an impact on intrinsic value estimates across our coverage.
We’re not saying that a weakening consumer, looming economic weakness and rising interest rates on the national debt won’t impact the markets, but such an dynamic within the discounted cash-flow (DCF) model should be relatively modest (as most value is generated by mid-cycle long-run considerations). The Fed’s rate hikes have already driven the discount rate within the market implied DCF higher, but inflation may have already peaked in June 2022, and many expect the pace of inflation to fall rapidly as 2023 progresses.
From my experience, the markets generally look (discount) roughly two to three quarters ahead, and what the charts are telling me is that inflation has peaked, the economy might bottom later this year, and that earnings growth will resume in earnest in 2024. The Invesco S&P 500 Equal Weight ETF (RSP) broke out recently and now the market-cap weighted S&P 500 Sector SPDR (SPY) has broken out. The technical downtrend that has been broken through defined almost all of 2022, and the path of least resistance now seems higher, in our view. The next few weeks, however, will be telling whether markets will sustain the breakout with a strong technical follow through.
Fourth-quarter 2022 earnings season is in full swing, and reports haven’t been that bad. Aside from Goldman Sachs’ (GS) fourth-quarter report, there haven’t been many big misses this quarter. S&P 500 earnings are expected to contract about ~5% during the fourth quarter of 2022, and while the outlooks for reporting companies such as Microsoft (MSFT) have been conservative heading into 2023, so far things are much better-than-feared, in our view. The forward 12-month P/E ratio for the S&P 500 stands at 17x, according to FactSet, which is below both the 5- and 10-year averages of 18.5x and 17.2x, respectively.
Here are some key developments during fourth-quarter 2022 earnings season thus far.
- One of our top stock ideas for 2023 is delivering. Tesla (TSLA) reported fourth-quarter revenue growth of ~37% on a year-over-basis, while its non-GAAP earnings per share exceeded the consensus mark by $0.08. For all of 2022, Tesla pulled in operating cash flow of $14.7 billion and free cash flow of $7.6 billion. It ended the year with $22.2 billion in cash and investments, and CEO Elon Musk had some very optimistic comments regarding order trends. Year-to-date, shares of Tesla are up nearly 50%!
- Simulated newsletter portfolio holding Chevron (CVX) declared a $1.51 per share quarterly dividend, a 6.3% advance from the prior payout level, while it announced a massive $75 billion share buyback program. Our fair value estimate of Chevron stands at $205 per share, so with shares trading at ~$185 each, we like the news. The company’s performance since it was added to the newsletter portfolios has been a key reason behind the newsletter portfolios' resilience during some of the worst of times within the technology sector last year.
- One of our favorite semiconductor stocks ASML Holding (ASML) reported fourth-quarter earnings that beat both top- and bottom-line expectations. Revenue advanced an impressive ~29% while gross profit leaped ~22.6% in the quarter, and we continue to like how well the firm is positioned for the long run, “ASML Launches Big Buyback; Lithography Systems Well Positioned for Demand Growth.” Quarterly net bookings were solid, and the firm expects net sales to advance 25% in 2023. We like ASML as one of the top holdings in the ESG Newsletter portfolio.
- High Yield Dividend Newsletter portfolio holding Crown Castle (CCI) reiterated its full year 2023 guidance calling for adjusted EBITDA in the range of $4.449-$4.494 billion, adjusted funds from operations in the range of $3.296-$3.341 billion, and adjusted funds from operations (AFFO) per share of $7.58-$7.68 per share. Crown Castle’s forward estimated annual dividends per share stands at $6.26 per share, so the REIT’s dividend coverage with AFFO remains healthy, in our view. Crown Castle will continue to contend with deteriorating REIT economics, however.
- IBM (IBM) reported decent fourth-quarter results, but free cash flow generation in the quarter came up short relative to expectations. The company is targeting 2023 free cash flow of $10.5 billion, up more $1 billion on a year-over-year basis, and it expects constant-currency revenue growth in the mid-single-digits. IBM’s dividend should remain covered by free cash flow during 2023, and its stock yields ~4.7% at the time of this writing. Long-term uncertainty regarding its future free cash flow expectations in light of the fourth-quarter shortfall coupled with a massive net debt position keep us on the sidelines, however.
- 3M’s (MMM) stock has been in a world of hurt of late. The company is contending with contingent liabilities associated with polyfluoroalkyl substances (PFAS), “forever chemicals,” of which it expects to exit by 2025, and allegations that it sold the military defective earplugs that harmed solders’ hearing--with estimates that it is spending hundreds of millions of dollars defending itself. 3M has a lot on its plate these days, and the firm guided 2023 total adjusted sales to fall between 2%-6%, and adjusted earnings for the year to fall to the range of $8.50-$9.00 per share, below last year’s level of $9.88 per share. We just can’t get comfortable owning 3M these days, despite its lofty ~5.3% dividend yield.
- Boeing’s (BA) shares have staged a huge comeback the past several months as the company works through negative publicity associated with the 737 MAX and resumes deliveries of key airplanes, including the 787 Dreamliner. The big story with Boeing remains its free cash flow recovery, and during the fourth quarter, it generated $3.1 billion in free cash flow, which is a huge improvement, but one that we were expecting. We continue to expect Boeing’s free cash flow to recover as it works through inventory via deliveries, but shares have run too far too fast, in our view, trading at the high end of our fair value estimate range. Boeing's lack of a dividend and huge net debt position are two more reasons why we remain on the sidelines.
Concluding Thoughts
The market-cap weighted S&P 500 has broken out of the technical downtrend that defined 2022 following the equal-weight breakout that preceded it. The pace of inflation looks like it peaked in June 2022, and while myriad risks to both the economy and stock market remain, fourth-quarter 2022 earnings season is shaping up better than feared. We maintain our view that the markets remain at critical technical levels, and we continue to monitor earnings season and technical developments closely.
NOW READ: The Role of Luck in Investing and How To Think About It
----------
Brian Nelson owns shares in SPY, SCHG, QQQ, DIA, VOT, BITO, RSP, and IWM. Valuentum owns SPY, SCHG, QQQ, VOO, and DIA. Brian Nelson's household owns shares in HON, DIS, HAS, NKE, DIA, and RSP. Some of the other securities written about in this article may be included in Valuentum's simulated newsletter portfolios. Contact Valuentum for more information about its editorial policies.
Valuentum members have access to our 16-page stock reports, Valuentum Buying Index ratings, Dividend Cushion ratios, fair value estimates and ranges, dividend reports and more. Not a member? Subscribe today. The first 14 days are free.
1 Comments Posted Leave a comment