Dow Fell 9.99%, Worst Point Drop in History, More Nibbling?
publication date: Mar 13, 2020
|
author/source: Brian Nelson, CFA
Dow Fell 9.99%, Worst Point Drop in History, More Nibbling?
---
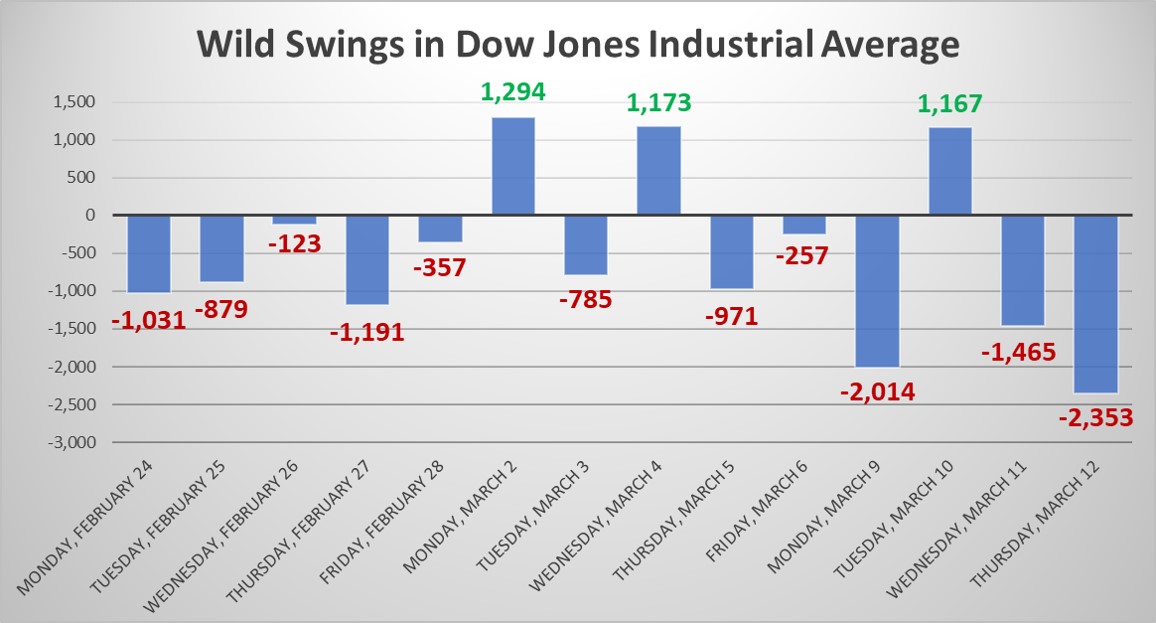
Image: On March 12, 2020, the Dow Jones Industrial Average fell 2,353 points, the most in its history, and the most in percentage terms since Black Monday in 1987. The Dow Jones Industrial Average fell 9.99% March 12, 2020, to 21,200.62.
---
From Value Trap: During the dark days of 2008 and 2009...where widespread and indiscriminate selling was prevalent, correlations among stock sectors rose considerably. According to data from Morningstar, average daily correlation over the trailing six months between individual stocks increased to 0.66 at the end of 2011 from just 0.10 in 1994. The average sector correlation for monthly returns on the S&P 500 index was 0.84 during the Financial Crisis period 2008-2012, up from 0.69 between 1994-2008. The rise in the correlation between US (S&P 500 index) and non-US stocks (the MSCI EAFE Index) increased to 0.95 during the period 2000-2011, up from 0.48 during the period 1970-2000. There may be a lot of truth to the saying that stock correlations approach one during times of economic crisis. -- Value Trap, published 2018
---
By Brian Nelson, CFA
---
Every stock in the S&P 500 (SPY) fell during the trading session March 12, except one. The Dow Jones Industrial Average experienced the biggest point drop in history, Europe was crushed, gold and crypto-currencies sold off, Treasuries and munis were weak, as correlations among almost all asset classes approached one, as they often do during economic crises.
---
Thursday, the S&P 500 closed at 2,480, near the low end of our 2,350-2,750 target range, and given the massive historical decline March 12 (the biggest point drop in history), equities are now starting to reflect a more neutral risk-reward balance at current levels, though we note downside risks remain. It may be time to consider doing some more nibbling on some of your favorite ideas.
---
Where should you look? Our favorite ideas are always included in the Best Ideas Newsletter portfolio, Dividend Growth Newsletter portfolio, High Yield Dividend Newsletter portfolio and Exclusive publication. In particular, we think ideas that have strong net cash positions, strong economic returns ("castles"), solid moats around their operations (competitive advantages), and strong free cash flow generation are the places to look during crises.
---
In the Best Ideas Newsletter portfolio, that includes companies such as Facebook (FB) and Alphabet (GOOG), but we'd consider Visa (V) and Berkshire Hathaway (BRK.B) as iron-clad considerations as well. In the Dividend Growth Newsletter portfolio, the pickings of entities with strong net cash positions are a little slimmer, and we might consider inching into a more diversified ETF such as the S&P Dividend ETF SPDR (SDY). Always ask your personal financial advisor what is right for you.
---
Of note, Apple (AAPL) and Microsoft (MSFT), two companies previously removed from the newsletter portfolios, are back on our radar as a result of the massive market declines. We also closed the put option protection for the second time more recently, yesterday, as we gear up for what looks like a bear market rally March 13. Investors continue to assess the long-term implications of COVID-19 on consumer behavior, and price-agnostic trading (indexing/quant traders) will continue to whipsaw this market.
---
In this tumultuous environment, stick to high quality companies, with strong net cash positions, and solid free cash flow generation (i.e. intrinsic value support), and don't catch over-leveraged, falling knives with phantom dividend yields. Certain industries such as the cruise lines, department stores, airline stocks, and the like, were "uninvestable" prior to the collapse, and their lower prices today reflect more of the tremendous range of fair value outcomes for their intrinsic values as opposed to bargain prices.
---
---
After being lower a few hundred points on the Dow Jones Industrial Average in the overnight session, futures are now pointing to a very strong open the morning of Friday, the 13th, to the tune of about 1,000 points. We continue to be excited about stocks for the long run, and again, our favorite ideas are always included in the newsletter portfolios. If you're looking for entry points on some of your favorite names, today might offer an opportunity to consider them, with the understanding that markets could still go lower.
---
We're available for any questions.
---
Kind regards,
---
The Valuentum Team
www.valuentum.com
---
Related ETFs: GLD, GBTC, VGK, FEZ, HEDJ, EZU, IEV, IEUR, EPV, EURL, SPEU, DBEU, EEA, HEZU
2 Comments Posted Leave a comment