Walmart’s E-Commerce Growth Supports Long Term Dividend Strength
Image Source: Mike Mozart
By Brian Nelson, CFA
On Tuesday, May 18, Walmart (WMT) reported first-quarter 2022 results for the 13-week period ended April 30, 2021. Leading the charge was a 37%, 47%, and 49% leap in e-commerce sales in its Walmart U.S., Sam’s Club, and Walmart International segments, respectively, with management noting that sales through its online channel have “more than doubled over the last two years.” Walmart continues to embrace e-commerce and omni-channel capabilities, and that bodes well for the long-term sustainability of its dividend payout, in our view. Walmart’s shares yield ~1.5% at the time of this writing, and they have years of dividend growth ahead of them, in our view.
As one of the largest big box retailers in the world, Walmart is not resting on its laurels. During the past several years, the retail giant has invested heavily to stave off online competition, driving tremendous growth in sales volume at Walmart.com and Samsclub.com. In fiscal 2021, the company launched Walmart+, a membership program that includes unlimited free shipping on eligible items, unlimited delivery from the store and more. The company continues to reinvent itself and efforts have been paying off.
Walmart now has ~7,300 pickup and 5,200 delivery locations globally, and its majority stake in Flipkart, an India-based e-commerce leader, speaks loudly that Walmart is not only embracing changing consumer preferences that have been accelerated as a result of the COVID-19 pandemic, but also global expansion in some of the fastest-growing areas of the world. Non-Walmart U.S. sales account for about one third of total consolidated revenue at last tally.
Walmart is truly a free cash flow powerhouse, and fiscal 2021 (its last fiscal year ending January 31, 2021) was a phenomenal year for the company. Net cash flow from operating activities soared to $36.1 billion, while capital spending fell to $10.3 billion, driving free cash flow to $25.8 billion (up from $14.6 billion and $17.4 billion in fiscal 2020 and fiscal 2019, respectively). Thanks in part to pantry stuffing during the COVID-19 pandemic, comparable store sales both in its Walmart U.S. segment and Sam’s Club segment advanced an impressive 8.7% during fiscal 2021.
Strong comparable store sales momentum continued in the thirteen weeks ending April 30, 2021, too. Walmart U.S. comp sales advanced 6% in the period (16% on a two-year stack, adding the percentage growth from the first quarter of fiscal 2022 to that of the same quarter of fiscal 2021), with management noting that it experienced “share gains in grocery.” Sam’s Club comparable year-over-year sales increased 7.2% in the quarter. Walmart International sales were impacted by recent divestitures, but this division also experienced solid e-commerce sales expansion. Instead of backing down from the likes of Amazon (AMZN), Walmart’s e-commerce and omni-channel initiatives are bearing fruit across the board.
The company’s operating cash flow wasn’t as strong as the that of the prior year for the thirteen weeks ending April 30, 2021, due in part to an accrued liability build and some inventory build, but we’re not reading too much into this. The company’s consolidated gross profit margin advanced over a full percentage point versus last year’s quarter, while consolidated operating income jumped more than 32% thanks in part to higher profitability levels at Walmart U.S. and better performance from its Walmart International division following recent divestitures. Walmart International’s segment operating profit margin increased to ~4.2% from ~2.7% in last year’s quarter on a constant-currency basis.
Looking ahead to remainder of fiscal 2022 (ending April 30, 2022), consolidated sales, excluding divestitures, are expected to advance in the “low-to-mid single digits, while consolidated operating income is expected to increase “mid single-digits in constant currency.” Operating income at Walmart U.S. is anticipated to “increase (the) high single-digits.” Though some difficult year-over-year comparisons are to be expected following the panic buying during the worst months of COVID-19, management expects comp sales growth for its Walmart U.S. and Sam’s Club divisions to be up by the “low single-digits” for fiscal year 2022.
Walmart’s balance sheet remains quite healthy. As of April 30, 2021, Walmart held ~$22.8 billion in cash and cash equivalents on the books and short- and long-term debt of $43.8 billion. Though the company holds a net debt position, it’s not something that we’re worried about given the financial flexibility its strong free cash flow generation provides. During fiscal 2021, free cash flow generation of $25.8 billion covered cash dividends paid of ~$6.1 billion more than four times. Walmart’s dividend remains strong, and its Dividend Cushion ratio of 2.0, as of this writing, points to future growth in the payout.
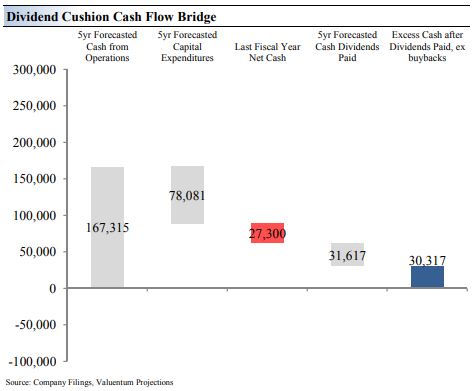
Image Shown: Found within each company's Dividend Report (pdf) on their respective stock pages (e.g. WMT), the Dividend Cushion Cash Flow Bridge illustrates the components of the Dividend Cushion ratio and highlights in detail the many drivers behind it. Walmart's Dividend Cushion Cash Flow Bridge reveals that the sum of the company's 5-year expected cumulative free cash flow generation, as measured by cash flow from operations less all capital spending, plus its net cash/debt position on the balance sheet, as of the last fiscal year, is greater than the sum of the next 5 years of expected cash dividends paid. Because the Dividend Cushion ratio is forward-looking and captures the trajectory of the company's free cash flow generation and dividend growth, it reveals whether there will be a cash surplus or a cash shortfall at the end of the 5-year period, taking into consideration the leverage on the balance sheet, a key source of risk. On a fundamental basis, we believe companies that have a strong net cash position on the balance sheet and are generating a significant amount of free cash flow are better able to pay and grow their dividend over time. Firms that are buried under a mountain of debt and do not sufficiently cover their dividend with free cash flow are more at risk of a dividend cut or a suspension of growth, all else equal, in our opinion. Generally speaking, the greater the 'blue bar' to the right is in the positive, the more durable a company's dividend, and the greater the 'blue bar' to the right is in the negative, the less durable a company's dividend. Image Source: Valuentum's Dividend Report on Walmart.
Concluding Thoughts
There are a number of dividend growth stocks that are on our radar, and Walmart is one of them. The company’s e-commerce and omni-channel initiatives have positioned it well for the long haul, and its free cash flow generation covers its cash dividends paid by a large margin. Strong comparable store sales momentum has continued into calendar year 2021 for Walmart, and we’re expecting another solid year of fundamental performance at the company. Walmart’s shares yield ~1.5% at last check, and we believe the company has years of dividend growth ahead of it.
Walmart’s 16-page Stock Report (pdf) >>
Walmart’s Dividend Report (pdf) >>
-----
Tickerized for WMT, TGT, COST, AMZN, KR, ACI, SFM, CHEF, USFD, SYY, UNFI, GO, WMK, VLGEA, IMKTA, SEGR
Valuentum members have access to our 16-page stock reports, Valuentum Buying Index ratings, Dividend Cushion ratios, fair value estimates and ranges, dividend reports and more. Not a member? Subscribe today. The first 14 days are free.
Brian Nelson owns shares in SPY, SCHG, QQQ, DIA, VOT, and IWM. Brian Nelson's household owns shares in HON, DIS, HAS. Some of the other securities written about in this article may be included in Valuentum's simulated newsletter portfolios. Contact Valuentum for more information about its editorial policies.
1 Comments Posted Leave a comment