Newmont Approves Another Massive Dividend Increase
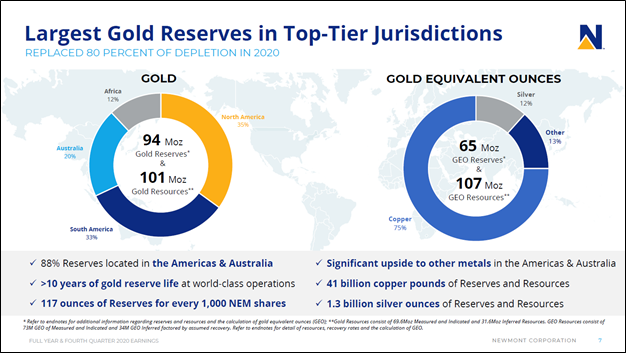
Image Shown: An overview of Newmont Corporation’s resource base, which is heavily weighted towards gold with its producing mines primarily located in the Americas and Australia. The company also has some exposure to copper and silver along with other raw materials. Image Source: Newmont Corporation – Fourth Quarter of 2020 IR Earnings Presentation
By Callum Turcan
On February 18, gold miner Newmont Corporation (NEM) reported fourth quarter earnings for 2020 that beat consensus bottom-line estimates but missed consensus top-line estimates. We appreciated the major improvements in Newmont’s balance sheet last year (i.e., sharp reductions in its net debt load), the resilience of its operations in the face of the coronavirus (‘COVID-19’) pandemic, and the company’s ability to continue churning out sizable free cash flows in almost any environment. On February 17, Newmont increased its dividend by ~38% on a sequential basis, which we will cover later in this article. We continue to like exposure to Newmont in the Dividend Growth Newsletter portfolio.
2020 in Review and 2021 Outlook
Newmont noted that it “produced 5.9 million attributable ounces of gold and over 1 million attributable gold equivalent ounces of co-products” last year in its latest earnings report. That was more or less on target with its internal estimates. Alongside its sizable gold output, Newmont produces zinc, lead, silver, and copper which represents its “gold equivalent” production base. The company noted output from its Yanacocha gold mine in Peru and its Cerro Negro gold mine in Argentina was negatively impacted by the COVID-19 pandemic last year, which played a key role in reducing its company-wide attributable gold production in 2020 by 6% on a year-over-year basis.
As global health authorities work towards putting an end to the public health crisis, aided by ongoing COVID-19 vaccine distribution efforts, Newmont’s production outlook will improve as the risk of temporary shutdowns at its mining operations starts to disappear. In 2021, Newmont aims to produce 6.5 million attributable ounces of gold and 1.3 million attributable gold equivalent ounces, which represent sizable year-over-year output growth. This trajectory will be supported by the ongoing recovery at its Musselwhite gold mine in Ontario, Canada.
Newmont noted it had recently completed two key projects at the Musselwhite mine in its latest earnings report, including the installation of a new conveyor system. Please note that a conveyor at the Musselwhite mine caught fire in 2019 which forced the mine to shut down for some time (we covered this situation here). Mining operations at Musselwhite resumed in limited capacity last year. Additionally, Newmont announced it had recently completed its materials handling project at the mine. This endeavor involved constructing a raise bore winze to improve the way ore is moved to the crusher, which is forecasted to generate meaningful operating expense improvements on a per-unit basis at the Musselwhite mine.
Management expects Newmont’s North American operations will post significant production growth and meaningful cost structure improvements in 2021 versus 2020 levels, as one can see in the upcoming graphic down below.
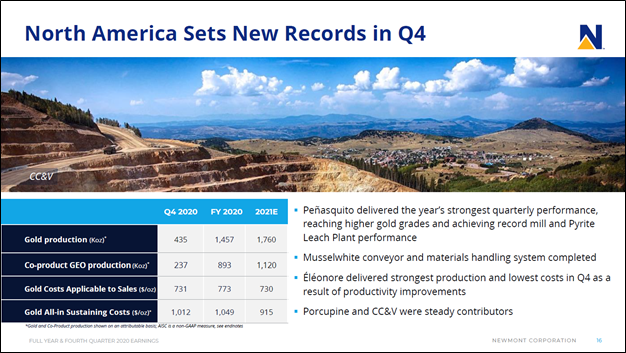
Image Shown: Newmont’s North American gold production outlook is supported by its Musselwhite mine returning to its full capacity. Management expects the cost structure of Newmont’s North American mining operations in the aggregate will improve in 2021 versus 2020 levels. Image Source: Newmont – Fourth Quarter of 2020 IR Earnings Presentation
Newmont’s Promising Income Growth Trajectory
Back on January 13, 2020 (link here), we added Newmont to the Dividend Growth Newsletter portfolio (please note Newmont’s corporate name has changed a few times). Shares of NEM closed at $42.45 that day according to YahooFinance data. At the time, the company had just announced its quarterly dividend was set to grow to $0.25 per share (starting in the second quarter of 2020) from $0.14 per share previously. In January 2020, Newmont’s merger with Goldcorp had closed less than a year ago and the firm had just formed the Nevada Gold Mines JV with Barrick Gold Corporation (GOLD). Newmont owns 38.5% of the JV while Barrick Gold owns the remainder and acts as the operator.
Economies of scale combined with synergies from the Goldcorp merger and Nevada JV provided Newmont with a powerful tailwind, as did a rally in gold prices. When Newmont reported its fourth quarter of 2019 earnings report roughly a month after we added NEM to the Dividend Growth Newsletter portfolio, the company increased its targeted synergies (in terms of cash flow improvements) to $500 million on an annualized basis by 2021 versus $365 million previously (more detail on that here). Better than expected improvements in its cost structure combined with a meaningful rally in COMEX gold pricing last year provided a massive tailwind to Newmont’s financial performance in 2020.
Newmont later raised its quarterly payout to $0.40 per share in late 2020 on the back of its impressive free cash flow generating abilities and stable production base, something we covered here. As mentioned previously, on February 17, 2021, Newmont boosted its quarterly payout (again) up to $0.55 per share for the dividend to be paid in March. As of this writing, shares of NEM yield ~3.8% on a forward-looking basis at the new payout rate.
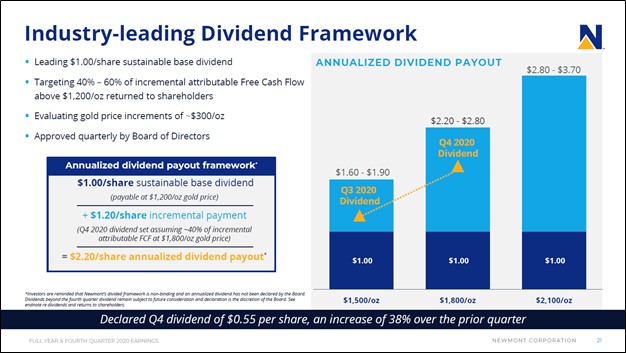
Image Shown: Newmont continues to aggressively increase its dividend, highlighting why we are big fans of the gold miner’s income growth upside. Image Source: Newmont – Fourth Quarter of 2020 IR Earnings Presentation
Rock-Solid Financials
In 2020, Newmont generated $3.6 billion in free cash flow, up from $1.4 billion in 2019. We are impressed with Newmont’s free cash flow generating abilities. Newmont spent $0.8 billion covering its dividend obligations and $0.5 billion buying back its stock last year, with both activities fully covered by its free cash flows and then some.
Most importantly, Newmont reported that its net debt load (inclusive of short-term investments and ‘current lease and other financing obligations’ and long-term 'lease and other finance obligations') fell from $4.4 billion at the end of 2019 to $0.9 billion at the end of 2020. Growth in its cash-like position on hand was primarily responsible for the sharp reduction in its net debt load. While Newmont had sizeable long-term investments on hand at the end of 2020 (~$3.2 billion), that is primarily represented by its strategic assets instead of cash-like assets.
Newmont’s sizable free cash flows and significant divestment proceeds last year helped the firm to aggressively de-lever the balance sheet, and we are huge fans of this improvement. On October 29, Moody’s Corporation (MCO) announced it had upgraded Newmont’s senior unsecured credit rating to Baa1 from Baa2 with a stable outlook. Newmont noted in its latest earnings presentation that S&P Global Inc (SPGI) had placed its current BBB credit rating on positive watch.
The gold miner recently authorized another $1.0 billion buyback program after recently completing its previous $1.0 billion share repurchase program. In our view, Newmont has the financial capacity to make good on its upsized dividend obligations while buying back its stock going forward, aided by its stellar free cash flow generating abilities in the current gold pricing environment and significant improvements in its balance sheet strength of late. We view Newmont’s share repurchases favorably as our fair value estimate for NEM sits at $67 per share, well above where Newmont is trading at as of this writing.
Concluding Thoughts
Though COMEX gold prices have moved moderately lower during the past few months, gold prices remain significantly above levels seen in January 2020 when we first added Newmont to the Dividend Growth Newsletter portfolio. Newmont remains one of our favorite miners out there, and we continue to like exposure to the name in the Dividend Growth Newsletter portfolio. The gold miner’s outlook is bright, and its financial position is rock-solid.
-----
Mining & Chemicals Industry - APD, DD, EMN, ECL, LYB, PPG, BHP, FCX, NEM, RIO, VALE, WPM, CMP, AA, KALU, MLM, VMC, NUE, CSL, SON, ALB, FUL, ATR, GGG, SHW
Related: GLD, SLV, MCO, SPGI
Valuentum members have access to our 16-page stock reports, Valuentum Buying Index ratings, Dividend Cushion ratios, fair value estimates and ranges, dividend reports and more. Not a member? Subscribe today. The first 14 days are free.
Callum Turcan does not own shares in any of the securities mentioned above. Newmont Corporation (NEM) is included in Valuentum’s simulated Dividend Growth Newsletter portfolio. Some of the other companies written about in this article may be included in Valuentum's simulated newsletter portfolios. Contact Valuentum for more information about its editorial policies.
0 Comments Posted Leave a comment