JPMorgan Outlines Scenario Where Dividend Could Be Cut
JPMorgan posted a terrible first-quarter 2020 report April 14, missing analyst expectations (which are a wild guess in times like these) by a long shot. If the economy continues to worsen, JPMorgan’s results will get uglier from here. On the earnings call, management indicated that second-quarter provisioning might be incrementally worse if the economy worsens. There is also room for deterioration in its Markets segment if trading activity dies down and one would expect the Asset & Wealth Management segment results to worsen if the markets are flat-to-down from here. The government rescue programs might also prove to be a temporary fix and consumer and business debt might just go bad later after an initial fix from stimulus funds received from the government. In the firm’s annual letter, Chairman and CEO Jamie Dimon also painted the picture for how the dividend could possibly be cut if things turn out worse than the more adverse scenario that the firm is postulating as one potential outcome.
By Matthew Warren
JPMorgan (JPM) posted a terrible first-quarter 2020 report April 14, missing analyst expectations (which are a wild guess in times like these) by a long shot. Earnings per share of $0.78 missed by $1.34 and revenue of $28.25 billion missed by $1.2 billion. Quarterly results were so dire that the company paid out more in dividends ($0.90/share) and share buybacks ($6 billion in net buybacks until buybacks suspended as of March 15) than it earned, which combined with balance sheet growth meant that the bank’s common equity Tier 1 ratio dropped down to 11.5% from 12.4% at the end of 2019, which we still consider to be a robust level.
The main reason for the big earnings hit and miss of consensus estimates was a firmwide reserve build of $6.816 billion pre-tax, which amounted to $1.66 of missing EPS, as compared to what might have been if credit quality had remained as benign as it had been in recent periods. Other notable items were a $951 million credit adjustment in the Corporate and Investment Banking (CIB) segment on losses related to funding spread widening on derivatives and firmwide bridge book markdowns of $896 million (probably mostly levered loans and high yield debt caught up in the pipeline between originating and distributing—while the spreads jumped out wider).
End-of-period loans were up 6% year over year as more clients drew down their revolvers, but deposits were also up a whopping 23% year over year at the end of period, as much of this money (and other) liquidity was parked at this high-ground bank. Just to show how stark the change in the business environment was during the quarter, one needs to look no further than JPMorgan’s debit and credit card sales volume year-over-year and merchant processing volume year-over-year in the two graphics down below.
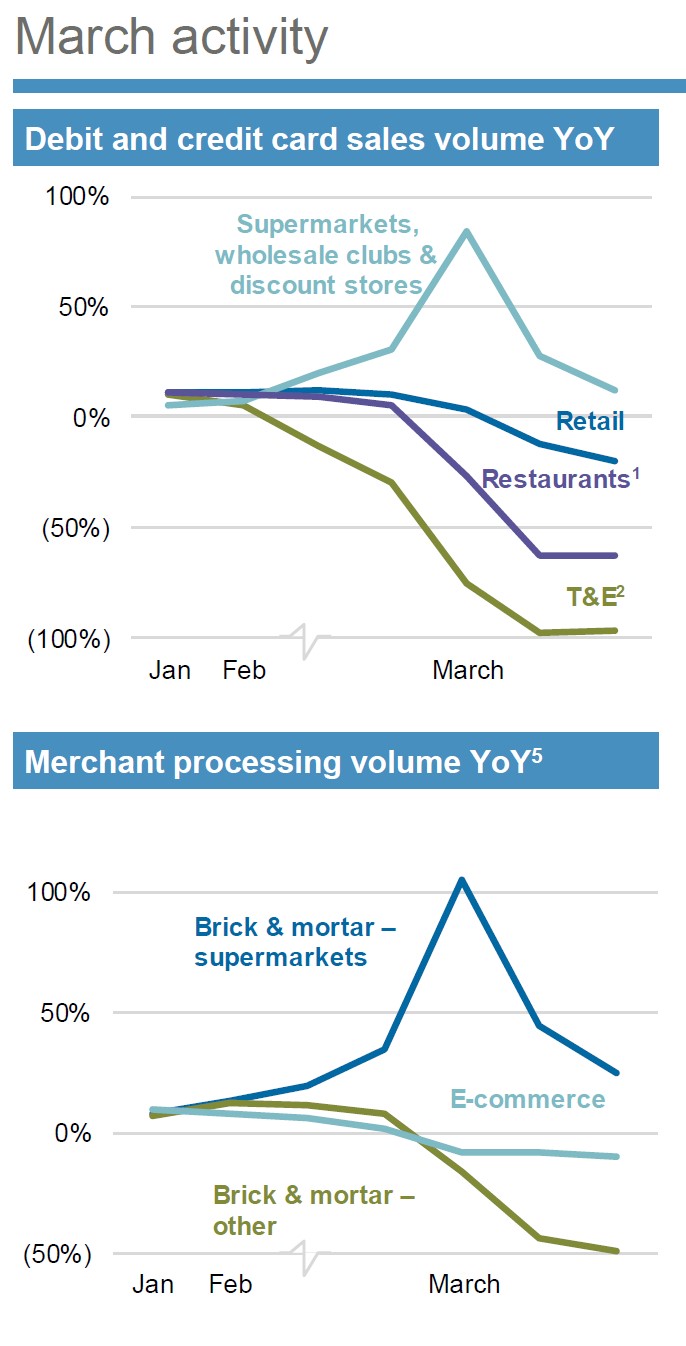
Source: JPMorgan 1Q20 Earnings Presentation
As shown above, client spending on travel and entertainment (T&E) dropped near zero as March progressed; restaurant spending dropped by more than half. Of interest, one can also see the spike in supermarkets, wholesales clubs, and discount stores as folks stocked up their pantries, before normalizing back to lower growth--more reflective of the channel shift from eating out to more meals at home. One can also see that e-commerce held up better in March than (brick & mortar – other) did, as cocooning at home was in full swing.
Aside from the drastically higher credit provisioning costs for expected upcoming bad debts, we also saw generalized revenue pressure from the lower-interest-rate effect on net interest margins and lower investment banking revenues as activity slowed. Higher markets activity from frenetic client trading during these volatile times was not enough to offset revenue pressure elsewhere. The broad revenue pressure also meant that efficiency ratios backed up to 57% from 55% in the same period last year. Return on equity dropped to 4% from 16% last year and return on tangible common equity dropped to 5% from 19% in last year’s first quarter.
If the economy continues to worsen, JPMorgan’s results will get uglier from here. On the earnings call, management indicated that second-quarter provisioning might be incrementally worse if the economy worsens. There is also room for deterioration in its Markets segment if trading activity dies down and one would expect the Asset & Wealth Management segment results to worsen if the markets are flat-to-down from here. The government rescue programs might also prove to be a temporary fix and consumer and business debt might just go bad later after an initial fix from stimulus funds received from the government.
In the firm’s annual letter, Chairman and CEO Jamie Dimon also painted the picture for how the dividend could possibly be cut if things turn out worse than the more adverse scenario that the firm is postulating as one potential outcome. Here is the scenario that might cause a cut in the payout, according to the firm:
…we have run an extremely adverse scenario that assumes an even deeper contraction of gross domestic product, down as much as 35% in the second quarter and lasting through the end of the year, and with U.S. unemployment continuing to increase, peaking at 14% in the fourth quarter. Even under this scenario, the company would still end the year with strong liquidity and a CET1 ratio of approximately 9.5% (common equity Tier 1 capital would still total $170 billion). This scenario is quite severe and, we hope, unlikely. If it were to play out, the Board would likely consider suspending the dividend even though it is a rather small claim on our equity capital base. If the Board suspended the dividend, it would be out of extreme prudence and based upon continued uncertainty over what the next few years will bring.
We are maintaining our $112 fair value estimate, which is just short of two times tangible book value of $60.71 per share. We think JPMorgan can earn middle to upper teens return on tangible capital through the course of most of the banking cycle, though it will have to fight through the difficult period ahead to prove this point yet again.
---
Valuentum members have access to our 16-page stock reports, Valuentum Buying Index ratings, Dividend Cushion ratios, fair value estimates and ranges, dividend reports and more. Not a member? Subscribe today. The first 14 days are free.
Matthew Warren does not own any of the securities mentioned. Some of the other securities written about in this article may be included in Valuentum's simulated newsletter portfolios. Contact Valuentum for more information about its editorial policies.
0 Comments Posted Leave a comment