Answering Some Questions from Our Members

Image Source: Eric
By Callum Turcan and Brian Nelson, CFA
Let’s answer some questions we received recently from our members. Please note that the wording of some of the questions was modified somewhat for clarity.
Question: What do you think about Moderna (MRNA), as their mRNA technology can be used for far more than just Covid-19 vaccines?
Answer: We are simply amazed at how fast the pharmaceutical industry, in conjunction with various partners and government programs (Operation Warp Speed and others), discovered a safe and viable vaccine for the coronavirus (‘COVID-19’). Moderna was key to making that possible after its COVID-19 vaccine received emergency approval from the US FDA in December 2020. With a vaccine efficacy of 94.1%, Moderna really was able to showcase the power of mRNA technology.
Looking ahead, Moderna’s vaccine pipeline (built upon its expertise in the realm of mRNA) is quite robust as you can see in the upcoming graphic down below, and we are particularly interested in its oncology and seasonal flu vaccine candidates (given the commercial potential in this area, and there is a very real societal need for improvements in battling the scourge that is cancer). Moderna’s outlook is fantastic, though with only one commercialized vaccine offering (for COVID-19), its fair value estimate range is rather wide.
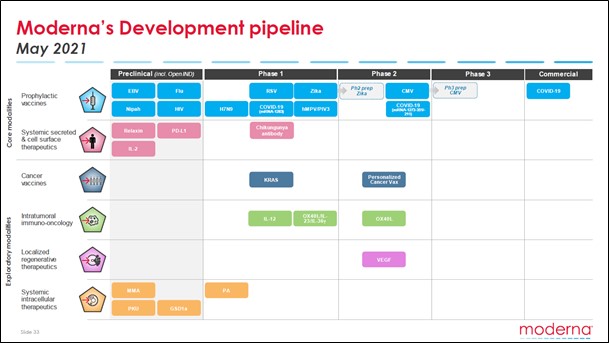
Image Shown: Moderna’s vaccine pipeline is robust and covers a lot of ground, underpinned by its cutting-edge mRNA technology. Image Source: Moderna – May 2021 IR Presentation
Question: First of all, thank you for the excellent work- it is a pleasure to follow your team’s ideas and how they work out! I read increasingly about the proposed changes in global corporate taxation and the implications this will have on big tech e.g., Alphabet (GOOG) (GOOGL), Microsoft (MSFT), Apple (AAPL), Facebook (FB). It will be probably interesting for your subscriber base to know your thoughts on that considering the weighting of these names in the sample portfolios.
Answer: Thank you for the warm thoughts, we appreciate it!
As it concerns the estimated cash tax rate for companies, through the enterprise cash flow analysis process we can stress test our models by adjusting the estimated corporate income tax rate to gauge the changes in fair value. Looking at the proposed minimum global corporate tax rate that has the backing of ~130 countries, at 15% that is unlikely to have a seriously deleterious effect on the major tech giant’s future forecasted free cash flows (it will impact their fair value estimates in a marginal to modest way).
Pivoting to the potential changes in the US corporate income tax rate, in our view, our base case is that there is a decent chance it gets raised up to 25% (up from 21% currently) rather than President Biden’s 28% proposal (not a guaranteed thing) given the opposition to a larger tax increase from some key Democratic senators. In any event, we are waiting for greater details on these situations and will update our cash flow models accordingly (with an eye towards the estimated future corporate cash income tax rate), but we continue to be huge fans of firms with net cash positions and strong free cash flow generating abilities whose outlooks are supported by secular growth tailwinds.
Large cap tech and payment processing firms, like PayPal (PYPL) and Visa (V), fit the bill.
Question: Regarding PPL Corp (PPL), is your VBI rating of 9 correct?
Answer: The utility PPL is quite an interesting firm given its transformative deal with National Grid plc (NGG) which we covered in our Utility PPL Is Pursuing a Major Transformation and Has a VBI Rating of 9 article (link here). In our view, investors are looking for greater clarity on what PPL intends to do with its large net cash infusion (the sale of its UK operations has been completed and now PPL is a pure play US utility) once its deal to acquire Rhode Island’s leading utility is complete (which is forecasted to occur by March 2022).
Debt reduction efforts are already underway, and the acquisition is going through the regulatory process, but investors likely want to know whether share buybacks, dividends and/or capital expenditures are going to be prioritized going forward (in other words, what are PPL’s core capital allocation priorities post-transformation). We are keeping an eye on the situation, and expect that during its upcoming earnings, PPL will provide some additional color here.
Note that we do not add all stocks that register high ratings on the Valuentum Buying Index (VBI) to the newsletter portfolios. Please see the last question in this Q&A roundup for further detail.
Question: Is there any news regarding the sale of Korn Ferry (KFY) top officers selling some of their stock?
Answer: While we always want to see executives have as much “skin in the game” as feasibly possible, insider stock buying and selling activity has only a modest impact on our outlook towards companies. The enterprise cash flow analysis model is built around the company’s future forecasted financial performance, and unless insider stock buying and selling activity indicates there may be trouble afoot (such as an accounting scandal, for example), executives cashing in some of their stock does not change our fair value estimate or view towards a firm. There is a long list of reasons why an executive would want to sell their stock. With shares of Korn Ferry trading near their all-time highs, some selling activity is to be expected from time to time. We continue to be big fans of Korn Ferry and like the firm as an idea in the Best Ideas Newsletter portfolio.
Question: What is a fair value estimate?
Answer: The fair value estimate is our best estimate of the true intrinsic value of the stock and rests as the highest point on the probability distribution of the fair value estimate range (as shown below), which itself represents a broader fair value estimate of the equity. The fair value estimate is derived by a three-stage discounted cash flow model (enterprise valuation), while the fair value range uses the fair value estimate as a midpoint to ascribe what we think would be a fair market price for the stock to trade within.
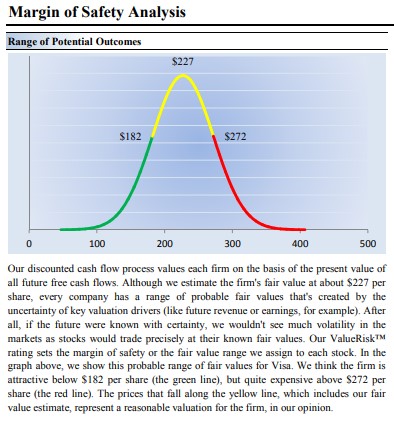
Image Shown: Visa’s fair value estimate range. Image Source: Valuentum’s 16-page stock report of Visa.
Let’s use Visa (V) as an example. Based on our discounted cash-flow process, we value shares of Visa at $227 per share. The stock trades at ~$248 per share at the time of this writing, so its price-to-fair value (P/FV) estimate stands at ~1.05. The low end of our fair value estimate range is $182 per share, while the high end of our fair value estimate range is $272. In other words, we could see shares of Visa rise to as much as $272 per share before we would grow concerned about its underlying valuation.
If Visa's shares dropped below $182 per share and carved out a nice bottom/base (meaning that the market was supporting the equity on a technical basis through strong relative strength and/or share-price momentum), it would register one of the highest ratings on the Valuentum Buying Index, and we would view it as one of the most attractively positioned stocks on the market, along with Facebook – which had been (and continues to be) severely underpriced while showing continued strong share-price momentum; hence, Facebook’s high rating on the Valuentum Buying Index.
Importantly, the fair value estimate, the price-to-fair value (P/FV) ratio, the fair value estimate range, and the Valuentum Buying Index are only a handful of metrics on our website to use to evaluate new ideas. The simulated newsletter portfolios help surface our favorite ideas in the construction of diversified equity portfolios, as in the case of the Best Ideas Newsletter portfolio and Dividend Growth Newsletter portfolio (the High Yield Dividend Newsletter portfolio offers even more diversified exposure). When adding or removing companies from the newsletter portfolios, we also consider market conditions and diversification parameters, so it's critical to reiterate that no metric should ever be used by itself.
Question: When I look at the company vitals information on the left side of the first part of each stock page, are the ‘Est. Normal Diluted EPS’ and ‘P/E on Est. Normal Diluted EPS’ essentially the same as 12-month forward EPS and 12-month forward P/E I see from other data sources (just worded differently and based on your estimates rather than “consensus figures”)? It seems like this would be the case, but I wanted to double check. Do you all back out the company’s net cash position when looking at this metric?
Answer: Our normalized P/E ratios and EV/EBITDA ratios consider the companies’ current price relative to the average earnings or average EBITDA over a reasonable forward-looking cycle, generally five years. For example, the ‘Est. Normal Diluted EPS’ will take the price at the time of the report and divide that by the average annual EPS over the next five years. The same process occurs with respect to the current price of EV (market cap plus book value of debt, preferred) divided by the average of annual EBITDA over the next five years.
The normalized measures are unique as they take into consideration our forecasts over the next five years within the context of our enterprise discounted cash flow process. The net cash position is not backed out of the ‘Est. Normal Diluted EPS.’ The net cash position is considered in our fair value estimate, namely the price-to-fair value (P/FV) ratio as well as in the context of enterprise value (EV), applied within the EV/EBITDA multiple, for example.
Question: Please explain the difference between the raw, unadjusted Dividend Cushion ratio and the adjusted Dividend Cushion ratio, and what is considered a good score for the unadjusted Dividend Cushion ratio, what is an excellent score, what is neutral and what is poor? Also, how much relative importance should I give to each score?
Answer: The raw, unadjusted Dividend Cushion ratio adds a firm's net cash position to the sum of its future free cash flows (cash flow from operations less all capital spending) over the next five years and takes that sum and divides it by the sum of the company's expected cash dividends paid and growth in them over the next five years. The Dividend Cushion ratio is essentially a coverage ratio -- the higher the ratio above 1, the better able the company will be able to cover dividend payments in the future, in our view. For most of our coverage and for most corporates, the qualitative ratings for safety and growth are a function of the raw, unadjusted Dividend Cushion ratio, as shown below.

For MLPs, REITs, and some utilities, however, we make modifications to the raw, unadjusted Dividend Cushion ratio in deriving the adjusted Dividend Cushion ratio. For example, with MLPs, we add back future equity issuance to the numerator and mitigate the company's debt load to a degree on account of assuming ongoing refinancing capacity for such entities. These adjustments result in a sharp upward revision to the raw, unadjusted Dividend Cushion ratio. For MLPs, REITs, and some utilities, we base the qualitative rating on this enhanced adjusted Dividend Cushion ratio, but we also disclose the raw, unadjusted Dividend Cushion ratio in each case.
In short, we believe both the raw, unadjusted Dividend Cushion ratio and the adjusted Dividend Cushion ratio offer insights. The former reveals the capital-market-dependency risks inherent to MLPs, for example, while the latter acknowledges that under benign market conditions, continued funding of the distribution/dividend would ensue. We place greater emphasis on the raw, unadjusted Dividend Cushion ratio because it is more of a pure risk measure than the adjusted one, which considers a variety of incremental funding sources, which cannot be guaranteed during difficult credit conditions.
Though we may make qualitative adjustments to the ratings themselves on account of other factors, the assigned breakpoints are as follows for both measures (they can be found on the definitions page in the Dividend report in the back): Dividend Safety. We measure the safety of a firm's dividend by adding its net cash to our forecast of its future cash flows and divide that sum by our forecast of its future dividend payments. This process results in a ratio called the Dividend Cushion™. Scale: Above 2.75 = EXCELLENT; Between 1.25 and 2.75 = GOOD; Between 0.5 and 1.25 = POOR; Below 0.5 = VERY POOR.
Question: How should an individual use the VBI rating when they just start using this indicator as input on new positions? In other words, how does someone build their own portfolio? The website indicates that the Best Ideas Newsletter portfolio contains the best ideas at any point in time, but the VBI rating on many of them would not indicate that someone should start a new position in them. I understand that portfolio management is a different topic then valuation, but I was interested to know how the Valuentum team would go about building a new portfolio if they were to start today.
Answer: We primarily use the Valuentum Buying Index as a screening mechanism to surface new ideas for consideration. The rating is not absolute within the investment-decision making process, meaning that there are other factors beyond the rating that we consider before a company is added to the newsletter portfolios, the most important of which is approval from the Valuentum team (a precursor to adding the company to the newsletter portfolios). Our research indicates that the VBI rating is highly effective across large sample sets, but we prioritize a qualitative overlay when running the concentrated newsletter portfolios which target 15-20 holdings.
We're not aware of your personal goals or risk tolerances, so we don't have a basis for suggesting how you should build a portfolio, or phase into holdings over time. We can never give any personal financial advice in that regard. That said, we use the VBI as a screening mechanism to surface ideas we want to add to the existing newsletter portfolios, to augment the existing positions in the newsletter portfolios in order to achieve the goals of both newsletter portfolios. We tend to add most 9s and 10s to the newsletter portfolios, but not all of them, and hold the ones that we add until they surpass fair value and begin to "roll over" from a technical standpoint, usually registering a 1 or 2 at that time.
There's a lot that goes into adding a company to the newsletter portfolios. Portfolio additions undergo a rigorous analyst-driven qualitative process, while the VBI rating is largely a quantitative output, though it, too, is driven by analyst expectations that drive the fair value estimate, which is a key component of the VBI. The following goes into why we consider the holdings in the newsletter portfolios the best ideas at any given time, and why at times non-portfolio holdings can have higher weightings than portfolio holdings: http://www.valuentum.com/articles/20151026_1.
Question: What is the performance of your Best Ideas Newsletter portfolio?
Answer: As a financial publisher and not a money manager, Valuentum does not have performance, per se. However, we think it's important to measure how well our idea generation has done within the Best Ideas Newsletter portfolio over time.
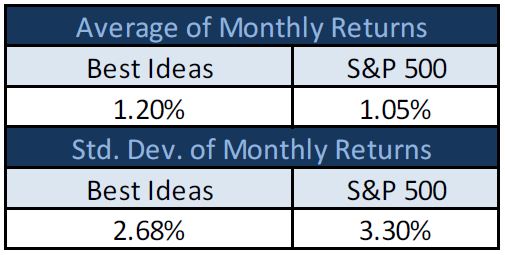
Image: The average monthly returns and standard deviation of returns for the simulated Best Ideas Newsletter portfolio relative to its declared benchmark, the S&P 500 (SPY), on an apples-to-apples basis, from inception, May 11, 2011, through December 15, 2017, with dividends collected but not reinvested for both the newsletter portfolio and the SPY. Returns are hypothetical. Past performance is not an indication of future performance. The hypothetical returns do not represent returns that any investor actually attained and do not include management or trading fees. Valuentum is a financial publisher.
What observers may not know is that over the time period, since inception in May 17, 2011, through the end of the measurement period, December 15, 2017, the portfolio held an estimated ~25% cash position. Think about this for a second. If we were to have scaled that cash position to zero or leveraged the equity component, it would resulted in even more impressive hypothetical outperformance.
Our team transitioned to weighting ranges at the end of 2017 for each portfolio position, which makes performance tracking a range depending on weighting permutations, but it's fair to say that things have continued to be awesome! You can read about how things shaped up in 2019 here, and how we performed during the COVID-19 crisis here. In light of the 130 percentage points of underperformance of the 60/40 stock bond portfolio the past 10 years relative to the SPY, Valuentum's Best Ideas Newsletter portfolio has been lights out.
What's more, it's not like we're just selecting and aggregating tickers either. We're building extensive discounted cash flow models and laying out our theses clear as day for all to see and follow our thought processes. Enough to bring out the champagne for a job well done, right? Absolutely. Cheers! View our 10-year anniversary video here. But there's much more that goes into the performance measurement for a financial publisher than a money manager.
In some ways, if you think about it, we may have done more than any shop out there the past decade or so. For one, saving investors tons of capital by warning about collapsing pipeline MLPs in 2015/2016, saving investors perhaps even more on the collapsing "value factor" in 2020, and then of course, our work during the COVID-19 meltdown. The helpful judgment provided by the Valuentum team has been invaluable, and all of this as icing on the cake given how successful the newsletter portfolios have been.
Thank you!
Concluding Thoughts
We appreciate the feedback and questions from our members and look forward to answering any questions in the future. Stocks for the long run!
Update: Frequently Asked Questions About Valuentum Securities, Inc.
Valuentum (val∙u∙n∙tum) [val-yoo-en-tuh-m] Securities Inc. is an independent investment research publisher, offering premium equity reports and dividend reports, as well as commentary across all sectors/companies, a Best Ideas Newsletter (spanning market caps, asset classes), a Dividend Growth Newsletter, modeling tools/products, and more. Independence and integrity remain our core, and we strive to be a champion of the investor. Valuentum is based in the Chicagoland area. Valuentum is not a money manager, broker, or financial advisor. Valuentum is a publisher of financial information. We address a number of questions from both subscribers and visitors to our site.
How Some Members Use Valuentum’s Investment Services
We serve a wide variety of investors, including dividend growth investors, value investors, and pure Valuentum investors, among others. Many different types of investors and professionals use our research and financial analysis in a whole host of applications from individual stock-selection to the evaluation of closed-end funds to an overlay in a money-management setting and beyond. The Best Ideas Newsletter portfolio seeks to find stocks that have good value and good momentum characteristics and typically targets capital appreciation potential over a longer-term horizon. The Dividend Growth Newsletter portfolio seeks to find underpriced dividend growth gems that generate strong levels of free cash flow and have pristine, fortress balance sheets, translating into excellent Valuentum Dividend Cushion ratios. The High Yield Dividend Newsletter portfolio seeks to find some of the highest-yielding stocks supported by strong credit profiles and solid business models, but not always robust traditional free cash flow. Ideas in this newsletter offer higher-yielding opportunities, but also much higher capital and income risk. We also offer a full suite of products to financial advisers (gold level) that range from a more extensive Excel-based screening tool (the DataScreener) to 'Ideas' and 'Dividend' publications that are released on a quarterly basis. Our research product includes hundreds of stock reports, fair values, fair value ranges, associated commentary, and hundreds of dividend reports with Valuentum Dividend Cushion ratios and expected dividend growth rates. Silver and gold-level members can add the Valuentum Exclusive or additional options commentary/ideas to their plans. The Exclusive publication is a part of the institutional (platinum) level membership.
-----
Related: MRNA, GOOG, GOOGL, AAPL, FB, MSFT, PYPL, V, PPL, NGG, KFY
Valuentum members have access to our 16-page stock reports, Valuentum Buying Index ratings, Dividend Cushion ratios, fair value estimates and ranges, dividend reports and more. Not a member? Subscribe today. The first 14 days are free.
Callum Turcan does not own shares in any of the securities mentioned above. Apple Inc (AAPL) and Microsoft Corporation (MSFT) are both included in both Valuentum’s simulated Best Ideas Newsletter portfolio and simulated Dividend Growth Newsletter portfolio. Alphabet Inc (GOOG) Class C shares, Facebook Inc (FB), Korn Ferry (KFY), PayPal Holdings Inc (PYPL) and Visa Inc (V) are all included in Valuentum’s simulated Best Ideas Newsletter portfolio. The Utilities Select Sector SPDR ETF (XLU) is included in Valuentum’s simulated High Yield Dividend Newsletter portfolio. Some of the other companies written about in this article may be included in Valuentum's simulated newsletter portfolios. Contact Valuentum for more information about its editorial policies.
2 Comments Posted Leave a comment