Nelson on Bogle, Part I
"The kind of commentary that makes broad generalizations about expectations of future returns is exactly why people are so eager to get into passive investment strategies. Since the 1920s, it seems as though the individual investor has assumed the stock market was rigged or impossible for average Joes to figure out, but instead of the "I'll get it next time" mentality that was present leading to the crash of '29, individual investors have "evolved" to the point that now the idea is if you can't beat the market, just buy the whole thing. Leaders like Bogle continue to take tremendous shortcuts in explaining forecasts, leaving the average investor like a student trying to copy math homework off a peer that didn't show his/her work. When the test comes around, and the problem is a bit different, the copier is up a creek." -- The Valuentum Team
Image shown: An example illustrating how the dividend is a component of capital appreciation that otherwise would have been achieved had the dividend not been paid. Such a situation applies to both regular and special dividends.
By Brian Nelson, CFA
Passive investing, or investing in a broad basket of stocks at any price and holding regardless of what happens, has become an increasingly popular investment hobby in recent years. Surely, a shopper of groceries would wait for items to go on sale at the store to make a purchase, but when it comes to investing, the price that investors are willing to pay for stocks seemingly doesn't matter for indexers. How has this happened? Are they being deceived?
Part of the breakdown in the logic, we posit, comes from making broad generalizations about expectations of long-term returns. The indexer seems to have completely forgotten about how present conditions can impact future returns, the very likelihood that future returns can even be negative, if investments are held at or near market tops, and that future positive returns for a market can never be guaranteed. It may not matter if market tops can be identified with precision either. The very idea that there are examples where market returns have been negative for years and even decades is enough proof that making broad generalizations about the expectations of future returns is about as ridiculous as it gets.
What's more, how John C. Bogle, the founder and retired CEO of the Vanguard Group, makes his forecast of future returns, as we reproduce below, only seems to confuse investors even more, in our view, to the point where they then may believe that the dividend payment is somehow incremental to a capital appreciation component. This is not true. The payment of the dividend theoretically detracts from the capital appreciation a stock would otherwise have achieved, "Understanding How Dividends Impact Valuation." Separating dividends as Bogle does in his variables that determine stock market returns, as shown below, implies that paying a dividend is an addition to stock market returns. That's backward thinking.
Though history has shown dividend payers have the propensity to outperform non-dividend payers over time, we think it is critically important that readers understand that the dividend, itself, is not incremental to returns, but instead it is a form of capital appreciation that is instead paid out to shareholders. The most prominent instance of this can be observed when a company pays a large special dividend, for example--e.g. Cracker Barrel (CBRL) here. In such an example, as in any other example of when a dividend is paid, a stock's share price is adjusted down, at market open, by the amount of the dividend payment, special or regular. The dividend is not incremental--it detracts from the capital appreciation that otherwise would have been achieved. See image at the top of this article.
How many investors don't understand this about the dividend! Is Bogle's forecasting technique, widely followed by investors, only making matters worse?
----------
From Common Sense on Mutual Funds, written by John C. Bogle:
These variables determine stock market returns over the long term:
1) The dividend yield at the time of initial investment.
2) The subsequent rate of growth in earnings.
3) The change in the price-earnings ratio during the period of investment.
The total of these three components explains nearly all of the stock market’s returns over extended holding periods. By analyzing the contribution to total return of the three factors, reasoned consideration of future returns can take place. The initial dividend yield is a known quantity. The rate of earnings growth has usually been relatively predictable within fairly narrow parameters. And the change in the price-earnings ratio has proven highly speculative. Total return is simply the sum of these three factors. For example, an initial dividend yield of, say, 3 percent plus a forecasted earnings growth of 7 percent annually over the next 10 years would bring the return to 10 percent. A change in the price-earnings ratio—from, say, 15 times at the beginning of the period to a forecasted 18 times at the end—would add 3 [sic] percentage points to that total, bringing the return on stocks to 13 [sic] percent. – John C. Bogle, Common Sense on Mutual Funds
----------
John C. Bogle is one of the most influential people in the investment world. For those that don’t know Bogle, he is credited with popularizing index funds and driving costs significantly lower across the mutual fund industry. There are even large groups of investors dedicated to following investing advice inspired by Bogle – they are called Bogleheads. The excerpt above from his highly-influential book Common Sense on Mutual Funds, pages 37-38 in my copy, may be helpful to the beginning investor looking to get some idea of what drives the long-term returns of stock prices, but what I would like to do is expand upon these three drivers so members know exactly how these three components interact with each other.
Understanding Total Return
As Bogle indicated, merely as a starting point, the total return of any stock can be broken into three pieces: dividend income (1, dividend yield) and capital appreciation (2, rate of growth in earnings and 3, change in price-earnings ratio). The best way to explain total return, in my view, however, may be to walk through a hypothetical individual’s personal financial situation as an example. That way we'll take corporate speak out of it, especially if the example with Cracker Barrel above didn't quite sink in with respect to the dividend.
A hypothetical person may have a source of annual income that he/she generates each year, and that same person may have savings in the bank and debt in the form of a mortgage or automobile payment. Let’s say that this person makes $25,000 per year in annual income after taxes and that he/she has $15,000 in savings and a total of $150,000 in mortgage and automobile debt. Let’s also assume that this person will receive a 3% raise every year for as long as he/she lives. The prevailing personal interest (borrowing) rate is 8% per annum. How might one think about this hypothetical person’s financial situation?
Interestingly, we can value this hypothetical person's financial situation the same way that we can value a stock. Let’s first assess the person’s future income stream in present value terms. Though this person will not work forever, for simplicity, let’s use a standard growing perpetuity function to value his/her income stream. Here’s what the equation looks like:
[(annual income)*(1 plus growth rate)]/(discount rate less growth rate)
[(25,000)*(1.03)]/(.08-.03)] = $515,000
Let’s now consider the personal balance sheet, or the person’s net debt position. Here’s that equation:
(cash less debt)
(15,000-150,000) = -$135,000
The present value of this person’s financial statement is $515,000 - $135,000 = $380,000.
Understanding How Dividends Interact with Capital Appreciation
What would the present value of this person’s financial statement be one year hence? Let's keep it simple and ignore living expenses and assume that out of the $25,000 in after-tax earnings generated during the year, $5,000 went toward paying down debt and $20,000 went directly to savings. For simplification purposes, let’s ignore interest received on cash and interest paid on debt, too. The standard perpetuity of the person’s income stream would be valued the same one year into the future, or $515,000. However, the personal balance statement would be different one year hence. Here’s the new equation:
($15,000+$20,000)-($150,000-$5,000)
($35,000-$145,000) = -$110,000
After the first year, this person’s financial statement is $515,000 - $110,000 = $405,000. This person’s financial situation has improved by $25,000 ($405,000 - $380,000) -- the difference is the $25,000 in after-tax earnings.
Let’s now see what happens in a case where this person pays himself/herself a personal dividend, perhaps a trip to the south of France that costs $10,000. This concept may be confusing in this example, but think of capital flowing out of one's pocketbook as similar to a company paying a special dividend, for example. Instead of the $20,000 going into the savings, as in the previous scenario, only $10,000 would go into the savings, as $10,000 would be needed to pay for the trip (the special dividend). The person’s balance sheet would now be the following:
($15,000+$10,000)-($150,000-$5,000)
($25,000-$145,000) = -$120,000
The person’s personal financial statement would now be $515,000 - $120,000 = $395,000, the difference being after tax income (cash flow) less the dividend payment, or $25,000 less $10,000 -- or $15,000 ($395,000 - $380,000).
Why Operating After-tax Earnings (Cash Flows) Drive Total Return
Let’s nail down two points from this exercise:
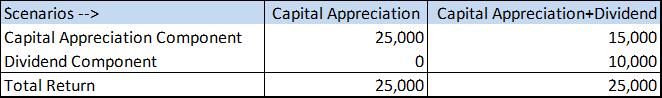
1) In the case where the person did not pay a personal dividend, the increase in his/her personal financial situation equals the after-tax increase in income (cash flows), or $25,000. Let’s call this scenario the ‘Capital Appreciation’ scenario, where the value of the personal financial situation increases from $380,000 to $405,000 during the first year.
2) In the case of the person paying a personal dividend, the increase in his/her personal financial situation still equals the after-tax increase in income (cash flows), or $25,000. However, the capital appreciation component accounts for $15,000 ($380,000 to $395,000), while the personal dividend (trip to the south of France) accounts for $10,000. Let’s call this scenario the ‘Capital Appreciation + Dividend’ scenario.
The ‘Capital Appreciation’ scenario is rather easy to understand. The person generated $25,000 in after-tax earnings (cash flow), added some of it to savings and repaid some debt, and therefore, he/she has increased his/her personal financial situation. The second scenario, or the ‘Capital Appreciation+Dividend,’ scenario is not as clear. The personal financial situation has increased $15,000 because of the "cost" of the personal dividend. However, the personal dividend is still a source of return because the person very much enjoyed the trip to the south of France, much like shareholders very much may enjoy a special dividend.
Here’s how the ‘Total Return’ breaks down graphically in the two scenarios.
Let’s now swap ‘person’ with ‘stock’ and make some very important observations. The total return of a stock is tied explicitly to the operations of the company, and more specifically, the future after-tax earnings (cash flow) generation of the firm. A company that does not pay a dividend has greater stock-price capital appreciation potential than if it were to pay a dividend because cash is not leaving the company in the form of dividends. Remember: the balance sheet is a source of value, much like a person’s savings is a source of value.
A stock that pays out a dividend has lower capital appreciation potential than if it didn’t pay a dividend because cash is leaving the company in the form of dividends. The dividend is still an important component of return, however. In both cases, however, the company’s total return is identical, as total return is explicitly based on the after-tax earnings (cash flow) generating capacity of any entity.
Why This Example Is Valuable
This example is valuable for a number of reasons. First, it shows how value (capital appreciation) is generated via after-tax earnings (cash flows) of the business. Second, it shows how the balance sheet (savings) is a source of value and how using internally-generated cash flows to add to cash on the balance sheet or pay off debt drives capital appreciation potential. And third, it shows how dividend payments impact a firm’s capital appreciation potential.
Since dividends detract from the cash that otherwise could have been added to the balance sheet or used to pay off debt, a firm is worth less than it otherwise would be if it had decided not to pay dividends. This dynamic explains why a firm’s intrinsic value theoretically should advance at the cost of capital less the dividend yield each year (or the cash flows generated less the cash flows paid out as dividends each year).
Example in Practice
Under this framework, it’s easy to see how total return is driven explicitly by the future after-tax earnings (cash flow) of a company and how capital appreciation and dividends interact with each other to derive that total return: the higher the dividend payments, the lower the capital appreciation potential of the company (than if it didn’t pay dividends), all else equal. This is based on the very real concept that a firm with significantly more net cash on the balance sheet is worth more than a firm with significantly less net cash on the balance sheet, all else equal.
Let’s now apply the numbers Bogle used in his example to further this understanding.
For example, an initial dividend yield of, say, 3 percent plus a forecasted earnings growth of 7 percent annually over the next 10 years would bring the return to 10 percent. A change in the price-earnings ratio—from, say, 15 times at the beginning of the period to a forecasted 18 times at the end—would add 3 [sic] percentage points to that total, bringing the return on stocks to 13 [sic] percent.
What may be going on in this example? Let’s get the more straightforward component out of the way first. The initial dividend yield is 3%, so we know that investors are going to receive 3% of their investment every year, but we really don't know how the price of the investment will perform, other than it will be 3% lower than it otherwise would had it not paid a dividend.
For simplicity purposes, let’s now talk about the price-to-earnings (P/E) ratio to begin the conversation about returns driven by price changes. We learned here that the numerator of the P/E ratio is a discounted cash flow model and that there are a large variety of inputs that can cause changes in the P/E ratio. In Bogle’s example, the P/E ratio is expected to increase to 18 times from 15 times over this 10-year period.
For starters, it is a big "no-no" in the professional investing world to base expectations of future returns based solely on expanding or contracting P/E multiples, but what are some things that might cause this P/E expansion? Well, quite simply, the company could have retained a significant amount of cash over the 10-year period, growing the value of its net cash position on the balance sheet. Just like in the personal balance sheet, more savings (cash) relative to debt is a good thing.
For example, if a company had $20 million in net income and $20 million in net cash at the beginning of the period, the company would be valued at $300 million, using the 15 times multiple (20 million in net income x 15 times). Excluding net balance sheet cash, the adjusted P/E multiple would be 14 times earnings. Assuming earnings grow 7% annually over the 10-year period, the company would record $39.34 million in earnings at the end of Year 10. At 18 times earnings, the company would then be valued at ~$710 million on Year-10 earnings (~$39 million times 18 times = ~$708 million).
Applying a 14-times (ex-cash) PE multiple, which we derived at the beginning of this period, to Year-10 earnings (14 times $39.34 million=~$550 million), this analysis would suggest that the company’s net cash balance expanded significantly to ~$160 million (~$708 million less ~$550 million), even as it paid out dividends to shareholders (it has a 3% dividend yield). In this example, just retaining earnings and cash on the balance sheet can drive P/E expansion, even if the core P/E, excluding net cash, multiple did not change.
Below, please find the definition of the P/E ratio and a list of factors that interact to derive each firm’s intrinsic PE multiple at any given time:
Forward Price to Earnings Ratio =
{[(Sum of Discounted Future Enterprise Free Cash Flows – Total Debt – Preferred Stock + Total Cash)/Shares Outstanding]/ Next Fiscal Year’s Earnings Per Share}
Note: The numerator of the PE ratio is a discounted cash flow model.
Revenue Growth: Impacts Future Enterprise Cash Flows (Mostly Positive)
Operating Earnings Growth: Impacts Future Enterprise Cash Flows (Positive)
Taxes: Impacts After-tax Earnings; Cost of Debt (Mostly Negative)
Capital Expenditures: Impacts Future Enterprise Cash Flows (Negative)
Return on Invested Capital (ROIC): Function of Operating Earnings and Net New Investment, Capital Expenditures (Positive)
Risk-free Rate, 10-year Treasury: Impacts WACC (Negative)
Discount Rate (WACC): Impacts Present Value of Enterprise Cash Flows (Negative)
Total Debt: Impacts Enterprise Value and Discount Rate (Mostly Negative)
Preferred Stock: Impacts Enterprise Value and Discount Rate (Mostly Negative)
Total Cash: Impacts Enterprise Value (Positive)
Shares Outstanding: Changes in Shares Outstanding (Neutral, assuming reinvestments' ROIC equal the firm’s WACC)
As outlined above, the numerator of the P/E multiple considers a plethora of factors in determining which multiple the market applies to a company’s earnings. In this regard, it becomes clear that it is quite silly to make hasty forecasts of price returns on the basis of expanding or contracting P/E ratios. There are simply too many factors to consider to merely expect expanding or contracting P/E ratios. For starters, the calculation of the numerator of the P/E is derived by a discounted cash-flow model, and the resulting equity value per share (the output of the discounted cash-flow model) is then divided by future earnings to arrive at what one might consider the true P/E. There's a lot of work involved.
Of note, if a company does not pay dividends, the equity value would be higher than it otherwise would be if it did pay dividends because a company’s net cash would be higher. A company’s P/E and capital appreciation potential are always higher than they otherwise would be if the firm opts to not pay a dividend (assuming the firm does not engage in value-destructing activities with the accrued cash). In Bogle’s example, the company’s total return potential would still be 13% if it didn’t pay a dividend -- but all of it would come from capital appreciation, as its P/E ratio would simply be higher (due to the higher net cash on the balance sheet, all else equal). The dividend is not incremental return but a component of total return.
Varying calculations of equity value relative to earnings are why we have a variety of different P/Es on the market today for companies with identical earnings. Capital-light companies (software, advertising companies) garner higher earnings multiples than capital-intensive companies (auto manufacturers) because capital-intensive companies have to reinvest a significant amount of cash back into their businesses. In a more pertinent example for this article, firms with billions in net cash garner higher P/E multiples than firms with billions in net debt.
Wrapping Things Up
Bogle has brought index investing to the individual investor's doorstep, and financial advisors are capitalizing on its low-cost approach in a big way. However, investors have to be very careful not to make future predictions about stock market returns that are simply illogical to justify, and then use those predictions as a reason for indexing. Please be even more careful to understand the true nature of the dividend payment, too.
Critically, dividend payments reduce a stock’s capital appreciation potential from what it otherwise would have been under a scenario in which it doesn’t pay a dividend. The discounted cash-flow model represents Bogle’s second and third components – the earnings (E) and price-earnings (PE) together. Changes in earnings and changes in the P/E collectively represent changes in firm value, and firm value is precisely what the discounted cash-flow model calculates. It doesn't make sense to hastily predict expanding or contracting P/E multiples.
Total return is not augmented by the dividend, in a theoretical and practical sense as shown in the Cracker Barrel example, but the dividend replaces a portion of the capital appreciation component. In the market today, however, this very concept may be being misconstrued. Dividend-paying firms could be receiving higher P/E multiples (rightly or wrongly) because they are paying a dividend, and the very concept of a growing dividend payment may be leading to more capital appreciation, bolstering overall total returns. What an interesting time 2017 is turning out to be -- and mostly because of ultra-low and sometimes negative real interest rates!
In all, however, please don’t fall into the trap of thinking that the dividend is incremental return. It’s nice to receive the dividend check, of course, but it means the company’s balance sheet net cash is just not as big as it could have been (if it didn't pay the dividend), and you now know how important the net balance sheet is to calculating intrinsic value and capital appreciation potential.
Part II of ‘Nelson on Bogle’ as President Brian Nelson addresses the ‘Concept of Inertia.’ The video of Part II can be found at the following link here.
A version of this article appeared on our website June 20, 2014. Tickerized for components in the Dow Jones Industrial Average.