Why Natural Gas Prices are So Low and Will Likely Remain So for Some Time

Image Source: Cabot Oil & Gas Corporation – November 2019 IR Presentation
By Callum Turcan
Domestic natural gas (UNG, UGAZ) strip prices in the US are trading at rock bottom levels (DGAZ) as of this writing, and we expect the pain will only continue. There are many reasons why natural gas prices in the US are quite low right now including surging associated production (gas supplies produced alongside oil, condensate, and natural gas liquids) from unconventional upstream plays where natural gas is viewed more so as a nuisance than a marketable product given the liquids-oriented economics of those plays, surging non-associated production (natural gas supplies are the only product) out of Appalachia over the past decade (the growth in natural gas production in Pennsylvania, Ohio, and West Virginia has been astounding due to the Marcellus and Utica shale plays), and the lack of the kind of serious weather-related demand this winter season (such as a very cold winter in North America, especially in the Midwest and East Coast) that can quickly drain flush storage facilities.
Some Background
For starters, it’s very important to note that while there are numerous natural gas pricing benchmarks in the US, when talking about US natural gas prices on a national level that almost always refers to the Henry Hub benchmark. Henry Hub is a natural gas pricing benchmark based on deliveries to Erath, Louisiana, which is located close to both major demand centers (on the domestic front, industrial, commercial, and residential consumers, and on the international front, export markets via its proximity to LNG or liquified natural gas exporting terminals) and major producing regions/plays (the Permian Basin, the Haynesville shale, the Eagle Ford, the Gulf of Mexico, and more).
While the US is now a leading natural gas exporter, supported by rising LNG exports to buyers all over the world (as new facilities and additions to new facilities are turned online) and growing pipeline exports to Mexico (made possible by building new transmission systems and cross-border connections), additional egress capacity hasn’t been the big win the industry thought it would be. Instead, upstream producers simply filled the gap and then some.
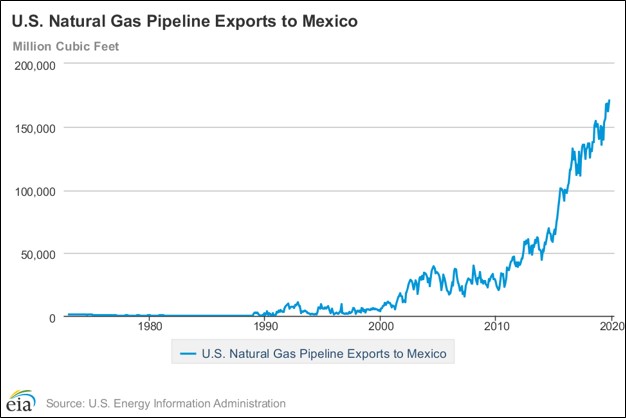
Image Shown: US gas pipeline exports to Mexico have surged over the past decade, in part because of Mexico’s push to utilize natural gas as a greater part of its electricity fuel mix. Image Source: US EIA Website
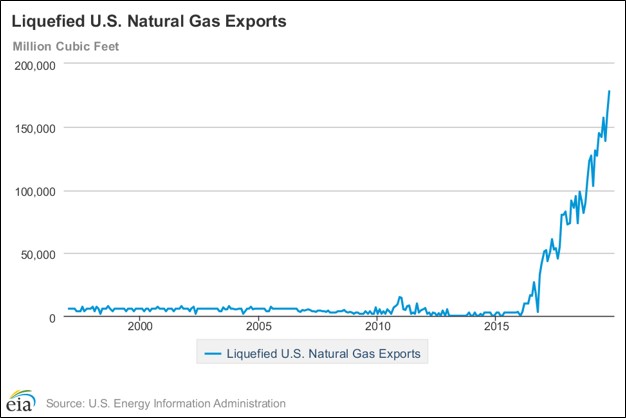
Image Shown: The US has gone from being a net importer of natural gas to a net exporter, in large part due to the rise of LNG exports and the end of LNG imports (on top of rising pipeline exports to Mexico). Image Source: US EIA Website
Looking at the Henry Hub strip says it all. For visual reference, the graphic below was added to showcase changes in the monthly spot price of Henry Hub over the years (picture is as of July 2019, spot prices have deteriorated further since then). As one can clearly see, LNG exports and rising power burn usage of natural gas (i.e. natural gas decimating and stealing thermal coal’s market share in the US electricity market by fuel type over the past decade) have not been the panacea that some claimed it would be in the past (in terms of reviving Henry Hub pricing).
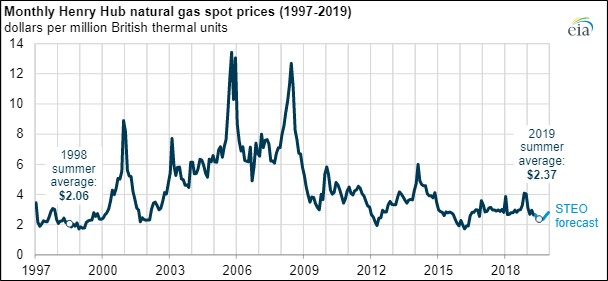
Image Shown: A look at the weakening of Henry Hub monthly spot prices over the years after the fracking boom took hold, which really started to take off from around 2010 onward. Image Source: US EIA Website
As mentioned previously, cheap natural gas supplies led to natural gas taking up a much larger share of US electric power generation by fuel type/energy source over the past decade or so. The graphic below showcases the paradigm shifting transformations of the US electric utility space, and ultimately, what led to the demise of thermal coal in the US. Going forward, please note the EIA does not expect natural gas to keep growing its market share as growth levels off in the face of rising renewable energy sourced electricity.
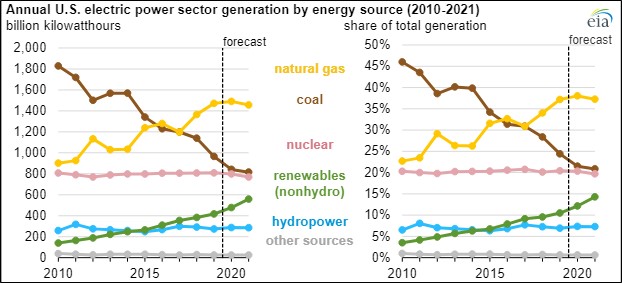
Image Shown: The demise of thermal coal in the US was largely due to cheap natural gas supplies, a product of the fracking boom. Image Source: US EIA Website
As of the US Energy Information Administration’s most current natural gas update as of this writing (released January 16 covering up to January 10), working gas in storage in the Lower 48 was 149 billion cubic feet higher than the five-year average. Please note that the five-year average is already arguably elevated due to surging domestic supplies, and resource scarcity is hard to come by when domestic output has grown by the levels seen in the US since 2010.
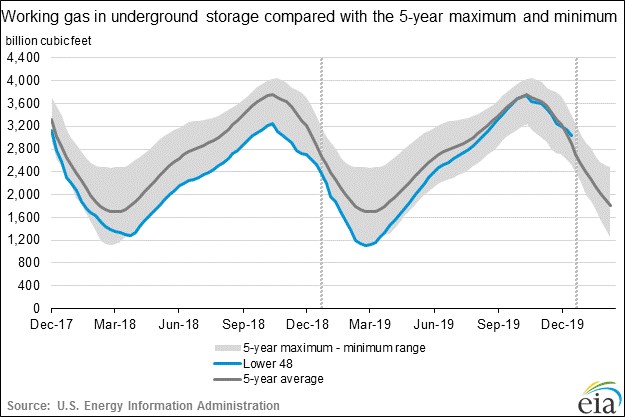
Image Shown: The US remains flush with natural gas supplies. Image Source: US EIA Website
Associated Production
In the graphic below, please note the sharp increases in associated natural gas production from some of the well-known unconventional hot spots in the US including; the oil-rich Bakken (largely in North Dakota), the liquids-rich Eagle Ford (in Texas), and the prolific Permian Basin (in West Texas and Southeastern New Mexico). Gas supplies from these plays, especially the Bakken and Permian (Eagle Ford gas supplies have access to better netbacks and are more relevant to expected upstream economics), are largely considered a nuisance for upstream operators given that development activities and well returns are predominantly underpinned by liquids (crude oil, condensate, and natural gas liquids).
As regional output outstrips egress capacity in key plays, like the Permian Basin, flared gas volumes have jumped. That means on top of already hefty marketable production levels of natural gas, there are meaningful gas volumes just waiting for a pipeline to come online to flood the market even more. Kinder Morgan Inc (KMI), a small holding in our Dividend Growth Newsletter portfolio, has been effectively capitalizing on this situation by bringing new long haul gas pipeline systems online in the Permian.
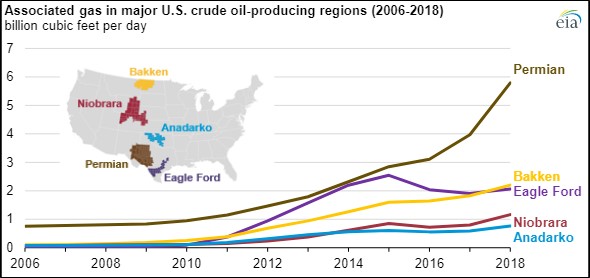
Image Shown: Associated natural gas production has skyrocketed in the US, a byproduct of the ongoing North American energy renaissance. Image Source: US EIA Website
Non-Associated Production
In the graphic below, please note the stupendous growth in US “dry shale gas production” which is another way of saying unconventional non-associated natural gas production. The most important region to keep an eye on is the ‘East’ given that’s where the Marcellus and Utica giants are situated, seeing as how that region is expected to continue posting stellar output growth going forward due to the low-cost nature of gas supplies out of those two plays. Pivoting to the Gulf Coast, the Haynesville shale play becomes interesting and worth developing in a world where unconventional upstream firms can realize prices of $3.00 or more per million British thermal units, keeping a lid on any potential rally in domestic natural gas prices.
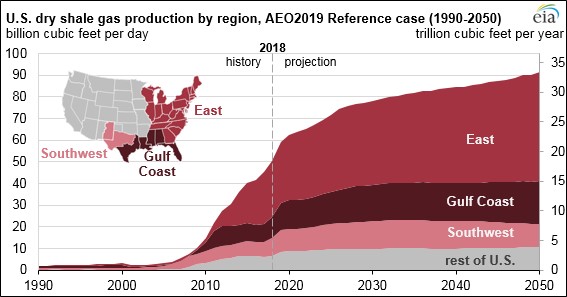
Image Shown: Surging natural gas production out of Appalachia is a leading cause for low US natural gas prices as of this writing. Image Source: US EIA Website
Weather
Natural gas is a very seasonal commodity and the 2019/2020 winter season, as cold as it has been in some places of the US, just wasn’t very cold. A warmer winter season, the big withdrawal period in the US (there are draws during the summer season as well, but that pales in comparison to what a big storm can do if it hits key demand centers in the Midwest and East Coast), meant that there would be no relief on the demand front for Henry Hub pricing.
Concluding Thoughts
As of this writing, Henry Hub futures are trading below $2.00 per mmBtu from February 2020 to April 2020. The market is clearly signaling the US does not need any more natural gas supplies, however, upstream companies continue to flood the market either because of the need to meet their firm transportation commitments (meaning these companies agreed to ship X amount of natural gas per day through a certain pipeline for a predetermined price back when natural gas prices were a lot higher, with that agreement lasting for a predetermined amount of time, or face penalties for not doing so) or because their natural gas production growth is supported by the economics of their oil production streams. It won’t be until supply growth slows down, if not downright halts, before Henry Hub can recover in a sustained manner. Demand growth alone can’t save Henry Hub.
Oil & Gas (Majors Industry) – BP CVX COP XOM RDS.A RDS.B TOT
Independent Oil & Gas Industry – APA COG CLR DVN EOG MRO OXY PXD
Industrial Minerals: ARLP, CCJ, CNX, HCR, NRP
Refining Industry – HES HFC MPC PSX VLO
Oil & Gas Pipeline Industry – ENB ET EPD KMI MMP
Utilities (Large): AEP, D, DUK, ED, EIX, ETR, EXC, FE, NEE, NGG, OKE, PCG, PPL, SO, XEL
Utilities: AEE, ALE, BIP, CMS, CNP, DTE, ES, LNT, MGEE, NI, NFG, PEG, PNW, SJI, SR, SRE, WEC
Related: UNG, UGAZ, DGAZ, ARMCO, XLE, XOP, VDE, AMLP, AMZA, KOL
-----
Valuentum members have access to our 16-page stock reports, Valuentum Buying Index ratings, Dividend Cushion ratios, fair value estimates and ranges, dividend reports and more. Not a member? Subscribe today. The first 14 days are free.
Callum Turcan does not own shares in any of the securities mentioned above. Kinder Morgan Inc (KMI) is included in Valuentum’s simulated Dividend Growth Newsletter portfolio. BP plc (BP), Enterprise Products Partners L.P. (EPD), and Magellan Midstream Partners L.P. (MMP) are all included in Valuentum’s simulated High Yield Dividend Newsletter portfolio. Some of the other companies written about in this article may be included in Valuentum's simulated newsletter portfolios. Contact Valuentum for more information about its editorial policies.
2 Comments Posted Leave a comment