The Valuentum Buying Index as a Differentiating Factor
"No other research provider has approached mapping the market in this manner, making Valuentum’s research a differentiating factor behind your practice and a must-have for any investor." -- Brian Nelson, CFA
By Brian Nelson, CFA
We have a huge day of earnings coming out today, and we’re excited about the upcoming releases at Apple (AAPL), Alphabet (GOOG) (GOOGL) and Microsoft (MSFT) after the close. Facebook (FB) is scheduled to report after the market close tomorrow, July 28. The important consideration, however, is how these reports impact our long-term forecasts, and we won’t be reading much into their share-price reaction to the reports, whether good or bad.
Valuentum stock reports for Apple here (pdf), Facebook here (pdf), Alphabet here (pdf), PayPal (PYPL) here (pdf), Twitter (TWTR) here (pdf), Qualcomm (QCOM) here (pdf), Microsoft (MSFT) here (pdf), and Korn-Ferry (KFY) here (pdf) have been refreshed with updated fair value estimates and pricing data. The data on their respective web page tables will be refreshed this weekend, as is customary with our update cycle.
Please note that while our process is systematic, we have a heavy qualitative overlay meaning our report update cycle is analyst-driven, not quant driven. This means that you should view our update process much like a sell-side analyst that controls his or her price target or recommendations, except of course that we have fair value estimates instead of price targets and that we don’t make recommendations.
To summarize some of the updates, Facebook’s shares remain super cheap, and it retains a 10 rating on the Valuentum Buying Index (VBI). Apple’s fair value estimate now stands at $150 per share. Korn Ferry’s shares remain cheap, but it no longer retains a high rating on the VBI. Alphabet's fair value estimate received a nice boost, too. The biggest driver behind the changes is more optimistic near-term earnings and free cash flow expectations relative to our previous views.
Let’s talk about the Valuentum Buying Index a bit. The VBI encapsulates how we’ve tried to map out the stock market to better explain returns relative to the archaic statistical models that use items such as size or book value. First, no model that maps the financial markets is going to be perfect. One only has to look at the three-factor, five-factor and other multi-factor models out there to see how little they explain of the cross section of stock returns in walk-forward studies.
Nonetheless, having a mental model about how to think about the stock market is extremely helpful, and the Valuentum Buying Index puts into perspective how we view the share price cycle. As shown in the picture below, we like to add companies to the Best Ideas Newsletter portfolio when the register a 9 or 10 on the VBI and remove them when they register a 1 or 2 on the VBI. The big middle is largely indeterminate or immaterial to our process (given that 3-8 can be found throughout the cycle and can either be good or bad).
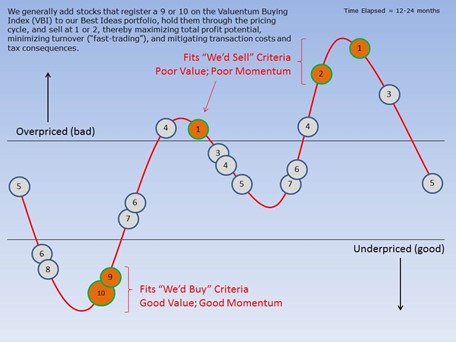
Image: The Valuentum Buying Index explanatory stock market return model. For illustratitive and educational purposes only. The Valuentum Buying Index should not be used by itself.
An examination of the process shows why there may be low VBI ratings in the newsletter portfolios. After all, holding a stock from when it registers a 10 to when it registers a 7 truncates performance, much like holding an undervalued stock until it first encounters the fair value estimate range limits returns that may come from continued momentum. In a perfect market, which it is far from, we would like to add 9s and 10s and hold them until they register 1s and 2s.
Only when a stock becomes overpriced and its technical and momentum indicators start to wane would we consider removing it from the newsletter portfolios, save for other portfolio construction considerations. For example, we may remove a decently-rated stock or ETF if we’re too overweight/concentrated in a certain sector, or if we feel that certain business model changes (i.e. transformative acquisitions, newly leveraged balance sheet) or exogenous risks not captured within the VBI, itself, warrant the stock's removal. One example of the latter might be if there was a geopolitical event or heightened regulatory risk.
The goal of the VBI rating is not to be a daily, weekly, monthly, or even quarterly trading system, but rather to provide a mapping system of the market to help readers better understand where we think the stock is on the pricing cycle. We think the VBI is a tool to use in conjunction with the fair value estimate range, Dividend Cushion ratio, Economic Castle rating, and a variety of other qualitative criteria to build a diversified portfolio of equities. The VBI should never be used by itself, and even what may look to be material changes in the rating may not be.
The VBI rating is not a stair-step function as with other systems where a stock may move from 5 star to 4 star to 3 star and so on. With the VBI, stocks can move from 3 to 6 back to 3 again over the course of the year, never triggering our interest. Some stocks do not have the fundamental characteristics ever to register a 9 or 10, and some that do may never make it to the newsletter portfolios as we won't favor either their industry structure or economic value capture, as measured by the Economic Castle rating.
No other research provider has approached mapping the market in this manner, making Valuentum’s research a differentiating factor behind your practice and a must-have for any investor. No system is perfect, but we continue to be impressed with how well 9- and 10-rated equities have performed, including the most recent 10, Facebook. We hope to continue to help you in all your equity research needs, but please be sure to always do your own due diligence. We can never provide you with buy/sell advice.
With that said, the following link is a great case study on the efficacy of the VBI. Enjoy!
Why Valuentum Buying Index Ratings Matter >>
----

-----
Image Source: Value Trap
----------
Valuentum members have access to our 16-page stock reports, Valuentum Buying Index ratings, Dividend Cushion ratios, fair value estimates and ranges, dividend reports and more. Not a member? Subscribe today. The first 14 days are free.
Brian Nelson owns shares in SPY, SCHG, QQQ, DIA, VOT, and IWM. Brian Nelson's household owns shares in HON, DIS, HAS. Valuentum owns shares in VOO, SCHG, DIA, and QQQ. Some of the other securities written about in this article may be included in Valuentum's simulated newsletter portfolios. Contact Valuentum for more information about its editorial policies.
0 Comments Posted Leave a comment