Southern Copper’s Payout Is Not That Healthy
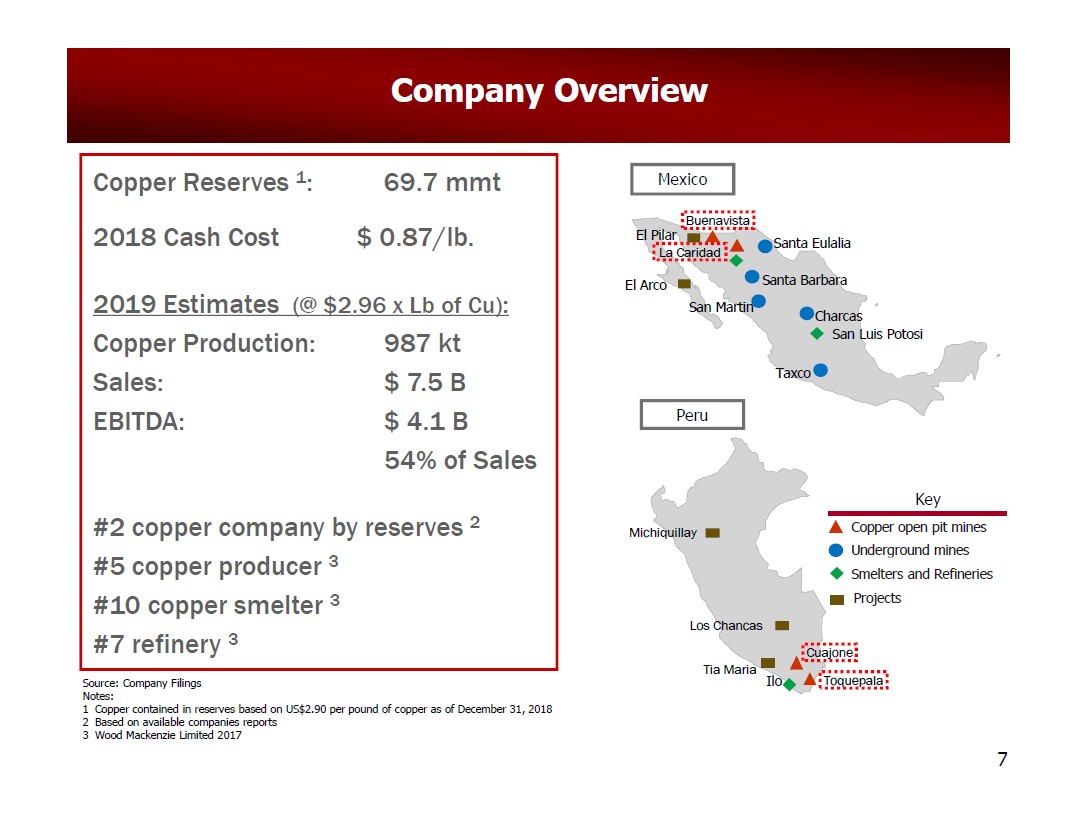
Image Shown: An overview of Southern Copper’s core operations in Mexico and Peru. Image Source: Southern Copper Corporation – May 2019 IR Presentation
By Callum Turcan
Copper (symbol Cu, atomic number 29) is an essential building block of modern civilization as it is used as a conductor for heat and electricity. Electrical components, utility-scale electrical transmission systems, residential and commercial heating appliances, electric vehicles, and much more all rely on copper products (electromagnets, heat exchangers, heat sinks, integrated circuits, printed circuits, copper wiring, and copper fittings are all examples of products that contain copper).
The largest consumer of copper is China, accounting for roughly half of global demand making the Middle Kingdom an essential part of the copper supply chain. On the other end of the supply chain, it’s companies like Southern Copper Corporation (SCCO) that develop and operate the copper mines in major producing regions that enable global supply to meet demand. As one can see in the upcoming graphic down below, copper plays an essential role in the transportation, industrial, consumer goods, utilities, and construction industries/sectors. The pace of construction activity in China has an outsize impact on global copper prices.
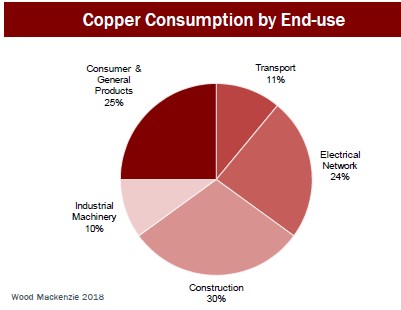
Image Shown: Copper plays an essential role in a wide variety of industries and sectors. Image Source: Southern Copper – May 2019 IR Presentation
According to Southern Copper’s 2019 Annual Report, copper prices on the Commodities Exchange (‘COMEX’) in New York and the London Metal Exchange (‘LME’) in London have been trending lower from 2010 to 2019. The slowdown in China’s annual economic growth rate was the likely culprit, as was rising supplies to meet demand that didn’t end up materializing at the pace expected.
Over the last decade, China’s economic growth rate reached its high point in 2010 (according to data from the World Bank) after a massive amount of stimulus spending was approved to combat the Great Financial Crisis (‘GFC’) in 2008, and trended lower throughout the decade due to a combination of factors (it’s significantly harder to grow a much larger economy, the diminishing returns from massive infrastructure developments, the rise of the US-China trade war, etc). Arguably, the relative slowdown in China’s GDP growth story pressured copper prices as mining projects and expansions that were approved in the 2000s based on China’s growth trajectory during that decade (for instance, from 2000 to 2007, before the GFC hit, China’s annual GDP growth rate surged from 8.5% to 14.2%) came online in the 2010s to a much different reality (China’s economic growth rate in the 2010s was impressive but not stellar).
That said, please note copper prices had recovered somewhat from their 2016 lows by 2019, before the ongoing coronavirus (‘COVID-19’) pandemic started pressuring prices due to the global economy coming to a temporary but screeching halt. In the upcoming graphic down below, we highlight the trajectory of copper prices per pound in US dollars over the last decade. As an aside, please note that as of May 19, near-term copper deliveries are trading just over $2.40 per pound as of this writing.
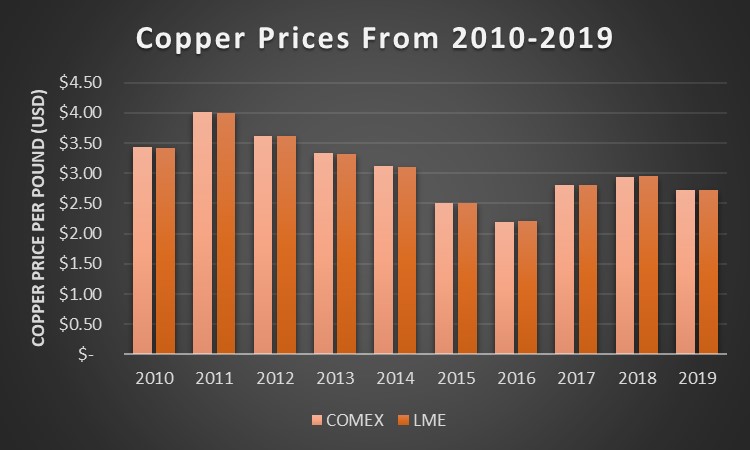
Image Shown: The average copper price per pound in US dollars from 2010-2019 on the COMEX and LME exchanges. Image Source: Valuentum, data sourced from Southern Copper’s 2019 Annual Report
Southern Copper
As it relates to Southern Copper, over the past three full years (2017-2019), the company derived ~81% of its revenues from copper. The rest of its revenues were derived from molybdenum, silver, and zinc sales. Due to the inherently volatile nature of commodity prices, Southern Copper prefers to secure long-term contracts that cover most of its expected production and on occasion, the firm will also hedge its pricing risk. Here’s a key excerpt from its 2019 Annual Report:
Our marketing strategy and annual sales planning emphasize developing and maintaining long-term customer relationships. Thus acquiring annual or other long-term contracts for the sale of our products is a high priority. Generally, 80% to 90% of our metal production is sold under annual or longer-term contracts. Sales prices are determined based on the prevailing commodity prices for the quotation period according to the terms of the contract.
In terms of producing assets, Southern Copper’s mining operations are located in Mexico and Peru and furthermore, the firm sees itself sitting on the largest amount of copper reserves in the world. At the end of 2019 and based on metals prices at the time, Southern Copper’s proven and probable copper and molybdenum (both metals are grouped together) reserve base stood at ~67-68 million tons. On top of its substantial copper and molybdenum resource base, Southern Copper also possesses modest zinc, lead, and silver reserves as well. Please note changes in metal pricing expectations impacts Southern Copper’s proven and probable reserve base due to changing economic expectations as it relates to extracting those resources.
Operations Update
Southern Copper is conducting exploration activities in Argentina, Chile, and Ecuador. From 2017 to 2019, the firm spent ~$29 million on average per year on those exploration activities, and the firm planned to spend ~$44 million on those activities this year (this forecast was given before the ongoing COVID-19 pandemic started spreading aggressively worldwide). Within Southern Copper’s 10-Q filing covering the first quarter of 2020, the firm had this to say on those endeavors:
The Company’s exploration activities in Argentina, Ecuador and Chile were also reduced [in response to the COVID-19 pandemic] and their drilling teams are on stand-by.
During the firm’s first quarter of 2020 conference call, management did not provide an update on Southern Copper’s exploration endeavors, but had this to say about the firm’s producing operations (emphasis added):
“Given the nature of mining operations, which are highly automated, conducted in remote locations and with mandatory use of personnel safety equipment, it is easier to implement and comply with COVID-19 protective measures such as physical isolation and access control. Industrial mining uses advanced and reliable machinery and does not require high physical concentration of employees. In many cases, workers fulfill their duties, maintaining distances of more than 100 meters from their coworkers.
The company has developed rigorous COVID-19 emergency protocols and only 40% of the labor force in Mexico, or about 6,300 employees, are currently working on-site under strict safety measures. The remaining workforce of 8,751 employees are working from home, including all high-risk individuals due to age or prior medical conditions. For the Peruvian operations, about 3,500 employees, or 39% of the workforce, are working onsite under strict safety measures, while the remaining 5,468 employees are working from home or staying at it. It should be noted that to date [as of late-April 2020], there has been not known cases of COVID-19 contagion among our employees at our mining facilities in Mexico and Peru.” --- Raul Jacob Ruisanchez, CFO of Southern Copper
Management noted during the Q&A session of the conference call that Southern Copper would have a better idea of how COVID-19 was impacting its production levels by July of this year. In the first quarter of 2020, Southern Copper mined roughly 0.25 million tons of copper along with modest amounts of molybdenum, zinc, and silver. As part of the reduction in its on-site workforce, certain works (like maintenance activities and leaching materials activities) have been delayed. While some of Southern Copper’s operations are continuing, it appears that its production levels will take a hit in the short-term. Please note Southern Copper also operates smelting and refining facilities.
Corporate Structure and Financials
Pivoting now to Southern Copper’s corporate structure and financials, please note that the NYSE-listed SCCO is only partially owned by outside stockholders as you can see in the upcoming graphic down below. Southern Copper is controlled by Americas Mining Corporation which in turn in controlled by Grupo Mexico SAB de CV (GMBXF), which owns mining operations and railways.
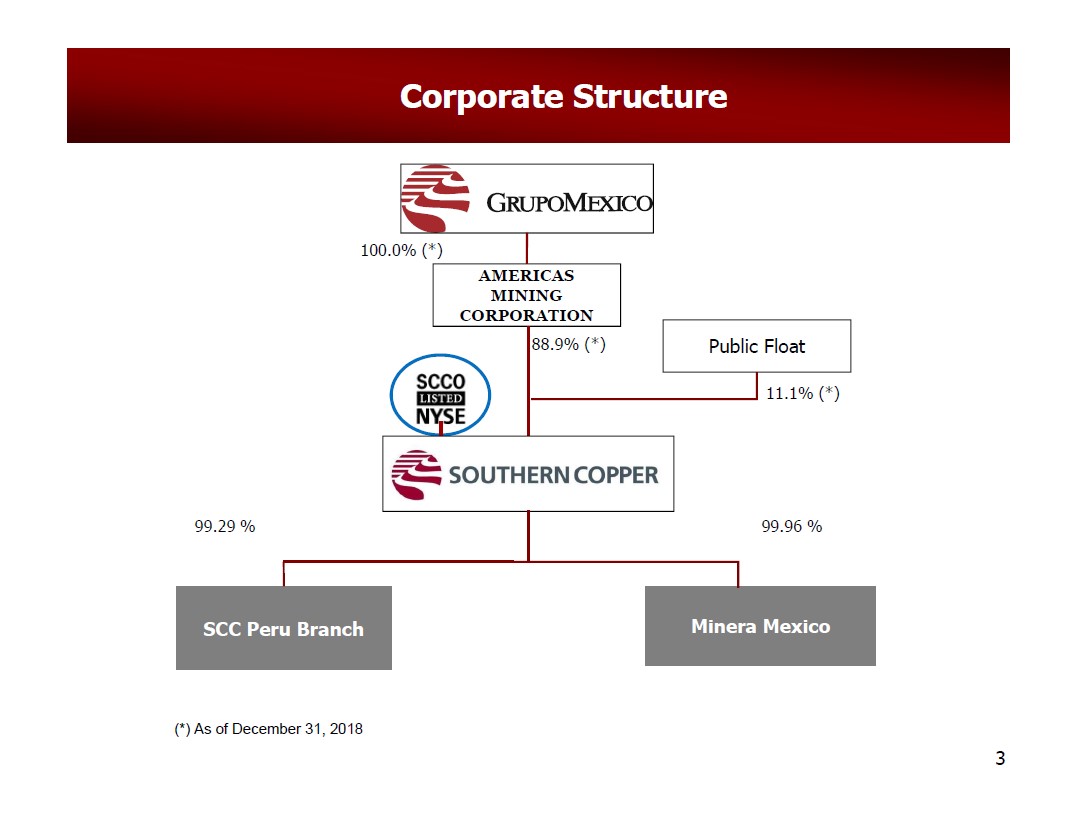
Image Shown: An overview of Southern Copper’s corporate structure as of the end of 2018. Image Source: Southern Copper – May 2019 IR Presentation
At the end of March 2020, Southern Copper had $2.1 billion in cash, cash equivalents, and short-term investments combined versus $0.4 billion in short-term debt and $6.5 billion in long-term debt. In April 2020, Southern Copper repaid its $0.4 billion in near-term debt maturities and now does not have any major debt maturities coming due until 2022 (as of mid-April 2020), providing the firm with ample liquidity to ride out the storm (though its current dividend payout remains at risk, which we’ll cover in just a moment).
The copper miner generated $475 million in net operating cash flow in the first quarter and spent $101 million on capital expenditures, allowing for $374 million in free cash flows. That fully covered $309 million in dividend payments paid during the quarter. Going forward, Southern Copper’s cash flow generating abilities will come under fire from lower copper prices and likely reduced production levels in the short term. In the first quarter of 2020, the company’s GAAP operating income declined from $694 million in the same period the prior year down to $533 million due to rising operating costs and weaker copper prices, offset somewhat by production increases.
We caution that while Southern Copper has plenty of cash on hand and no near-term debt maturities, its weakening cash flow outlook significantly raises the risk of a dividend cut. Our Dividend Cushion ratio sits at 0.0 for Southern Copper, earning it a “VERY POOR” Dividend Safety rating which could indicate a payout cut is coming in the medium-term. The justification is straightforward, Southern Copper carries a meaningful net debt position and needs to preserve cash on hand to fund its capital expenditures and cover ongoing operating costs during these challenging times. When its mining activities can ramp back up is also key here.
In the upcoming graphic down below, we highlight the numerator and denominator used in our Dividend Cushion ratio calculation, and Southern Copper’s two-page Dividend Report can be viewed here. As we noted in the report, “Southern Copper's dividends per share have started to stabilize but we caution that historically, the miner's payout has adjusted to changes in commodity prices and capital expenditure expectations” indicating that based on the firm’s historical dividend policy, management is open to adjusting Southern Copper’s payout program as needed.
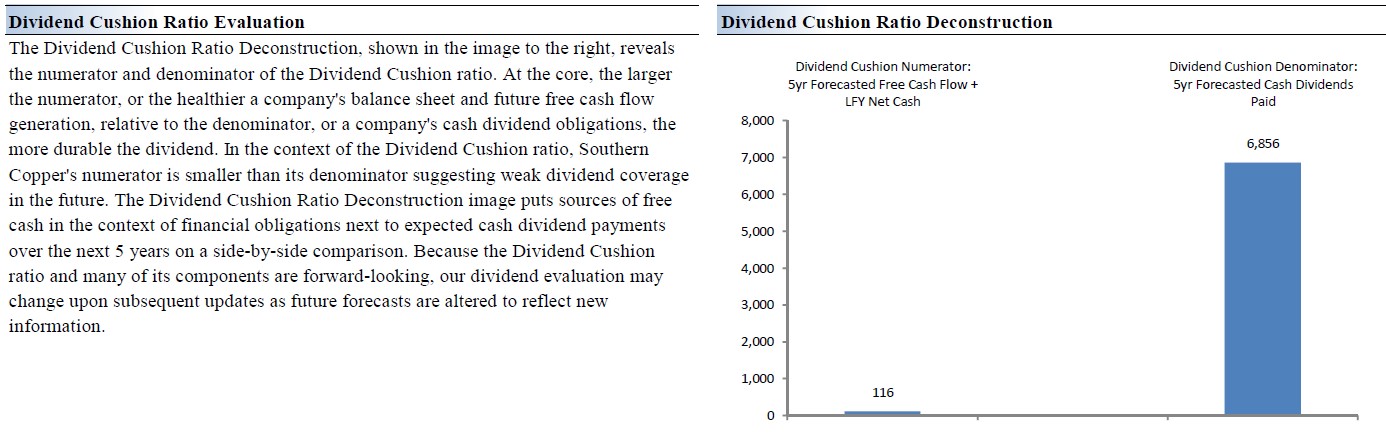
Image Shown: In our view, Southern Copper’s dividend coverage on a forward-looking basis is very weak. A payout cut has become increasingly likely in the medium-term.
Concluding Thoughts
Southern Copper has the financial strength to ride out the current economic downturn and the negative impact the pandemic is having on its producing mining operations; however, it likely does not have the financial strength to continue meeting its current dividend obligations short of a fundamental change in its near-term outlook. Its large net debt position and deteriorating cash flow outlook indicates a dividend cut may be in the works, though its ample cash position provides the company with a buffer for now. Shares of SCCO yield ~2.2% as of this writing and our fair value estimate of $35 per share indicates Southern Copper is fairly valued as things stand today, though a payout cut may pressure its share price in the short-term.
Our favor miner remains the gold mining giant Newmont Corporation (NEM) and members looking to read our thoughts on Newmont are encouraged to check out this article here.
-----
Diversified Mining Industry – BHP FCX NEM RIO SCCO VALE WPM
Related: GMBXF, FXI, MCHI, KWEB, JJCTF, COPX, DBB, CPER, JJC, TECK, HBM, AAUKF, AAUKY, GLCNF, GLNCY, FSUMF, ANFGF, SLV, SIL, USLV, PSLV, AGQ, SIVR, SILJ, SLVP, EWW, MXF
-----
Valuentum members have access to our 16-page stock reports, Valuentum Buying Index ratings, Dividend Cushion ratios, fair value estimates and ranges, dividend reports and more. Not a member? Subscribe today. The first 14 days are free.
Callum Turcan does not own shares in any of the securities mentioned above. Newmont Corporation (NEM) is included in Valuentum’s simulated Dividend Growth Newsletter portfolio. Some of the companies written about in this article may be included in Valuentum's simulated newsletter portfolios. Contact Valuentum for more information about its editorial policies.
0 Comments Posted Leave a comment