Some Questions Answered: The Fair Value Estimate Range and ROIC
Q: In the 16-page stock reports, why doesn't the 'percentage undervalued / overvalued' match up to the actual discount/premium to Valuentum's fair value estimate of the company?
A: We view the intrinsic value of a company as a Fair Value Range, not necessarily a single point estimate, so the undervalued and overvalued calculations match up to either the low fair value estimate or high fair value estimate, respectively. Within the context of a margin of safety, we wouldn’t necessarily view a company to be worth precisely $55 per share, for example; instead we'd view the company as worth between $50 (low end fair value estimate) and $60 per share (high end fair value estimate), with the low and high fair value estimates comprising the Fair Value Range in this hypothetical example.
We apply sensitivity analysis and scenario analysis with respect to a company’s future enterprise free cash flow stream to help inform the Fair Value Range of each stock, with the fair value estimate to be viewed as the most likely fair value estimate. As a result, the 'percentage undervalued / overvalued' is calculated by comparing the company's current price, as of the date of the report, with the low end and high end of its fair value range (not the single fair value point estimate), respectively.
If a stock's price falls below the low end of our fair value range, we'd view it as very cheap. If the stock price is above our fair value range, we think the company's shares are very expensive. If the stock falls within the fair value estimate range, we’d view it as fairly valued, though we still find valuable information in assessing the stock price’s relationship to the point fair value estimate, too.
As it relates to the percentage ‘Undervalued’ as shown in the case of Facebook’s report (dated December 3, 2021), specifically, the share price as of December 3 was $306.84, while the low end of its fair value estimate range as of the report date is $380 per share. Here is the calculation for the percentage ‘Undervalued’ in Facebook’s case, as shown in that report: [$380-$306.84]/$306.84 = 23.8%.
Q: I was wondering if you could provide more insight into Valuentum's ROIC calculations.
A: ROIC is the holy grail when it comes to assessing economic value creation!
Our ROIC calculation measures earnings before interest after taxes relative to the net operating assets of the firm. Some ROIC measures stick to GAAP data, but our measure is non-GAAP. We make a number of assumptions with respect to cash taxes in the numerator as in the process of enterprise valuation, and at times, adjustments to the denominator for entities with negative invested capital and others, which at times may impact the presentation of the ROIC percentage in the 16-page reports relative to our in-house valuation models.
For example, in some cases, we may exclude certain ‘Other Current Liabilities’ within our valuation model to arrive at a positive number in the denominator in order to reflect the economic substance of the business, where otherwise a great value-creating business would show a negative ROIC as the denominator would be negative because the business is very asset light. There may be additional ‘other assets’ (e.g. ‘Other Non Current Assets’) and ‘other liabilities’ that may be adjusted in our valuation model depending on analyst judgment on a case by case basis as each firm has different considerations. The goal of our ROIC calculation is to develop a metric to best reflect how to interpret the value-generating capacity of a business.
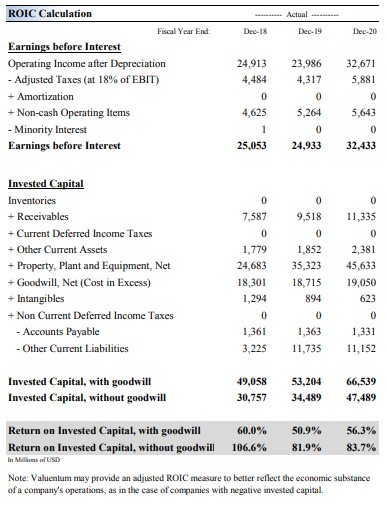
In the case of Facebook’s 16-page report, dated December 3, 2021, in particular, the ‘Invested Capital, with goodwill’ and ‘Invested Capital, without goodwill’ excludes both ‘Other Non Current Assets’ and ‘Other Current Liabilities’ within our valuation model, while the ‘Return on Invested Capital’ both with and without goodwill, as presented in the 16-page report excludes the ‘Other Current Liabilities’ line item as it uses a form of Adjusted Invested Capital in the denominator within the valuation model. Please note also that the Invested Capital in any ROIC calculation is the average of the past two years in the denominator.
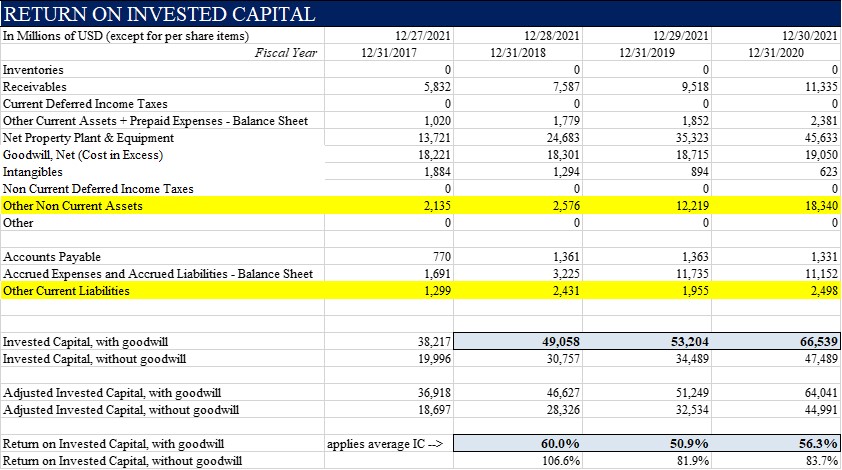
As in the case of the Facebook example, these adjustments to our in-house valuation models can at times impact the presentation in the 16-page reports. The calculation to arrive at the 60.0% return on invested capital in 2018 for Facebook is as follows: {25,053/[36,918+46,627]/2} = 60.0%. To better explain these adjustments, we’ve included the following images to show how the data is transferred from our valuation infrastructure into the reports. The blue highlighted cells in the valuation model snippet (first image below) are the ones found in the 16-page report for Facebook, for example, while the yellow cells include areas where subjective analyst determinations are made whether to include or exclude “other’ items, among other line items, where appropriate.
In most cases, our analysts make a determination within the ‘Invested Capital’ calculation by assessing “Other Non Current Assets” and “Other Non-Current Liabilities,” among other adjustments. The ‘Invested Capital’ items shown in the 16-page report may exclude both of these items, as in the Facebook example, while the ‘Adjusted Invested Capital’ in the valuation model may exclude ‘Other Current Liabilities,’ among other adjustments, as in the case of Facebook. Though our team may not make such adjustments as these for all companies, there are certain instances where analytical adjustments are made to enhance the meaning behind the measure and to better reflect the economic substance of the business, most often with negative or low invested capital companies, but also with other companies such as Facebook.
Modeling best practices often suggest to limit the impact of items where less insight can be gleaned, too (often, as in the case of ‘other assets and other liabilities’). We emphasize the occurrence of these unique circumstances in a note at the bottom of the ROIC calculation page in the 16-page report: “Note: Valuentum may provide an adjusted ROIC measure to better reflect the economic substance of a company's operations, as in the case of companies with negative invested capital.” We believe such adjustments are necessary for negative invested capital companies and help to augment the calculation in other cases.
Here is a snapshot of the valuation model (clarifications added) as well as the 16-page report of the ROIC calculation for Facebook.
From the model (clarifications added):
As translated into the report:
Download Facebook's report dated December 3, 2021 here (pdf) >>
Thank you!
Tickerized for holdings in the ARKK, as of December 23.
----------
Valuentum members have access to our 16-page stock reports, Valuentum Buying Index ratings, Dividend Cushion ratios, fair value estimates and ranges, dividend reports and more. Not a member? Subscribe today. The first 14 days are free.
Brian Nelson owns shares in SPY, SCHG, QQQ, DIA, VOT, BITO, and IWM. Valuentum owns SPY, SCHG, QQQ, VOO, and DIA. Brian Nelson's household owns shares in HON, DIS, HAS, NKE. Some of the other securities written about in this article may be included in Valuentum's simulated newsletter portfolios. Contact Valuentum for more information about its editorial policies.
1 Comments Posted Leave a comment