An Important Measure of Leverage for Dividend-Growth and Income-Oriented Shareholders, One That Is Dividend-Adjusted

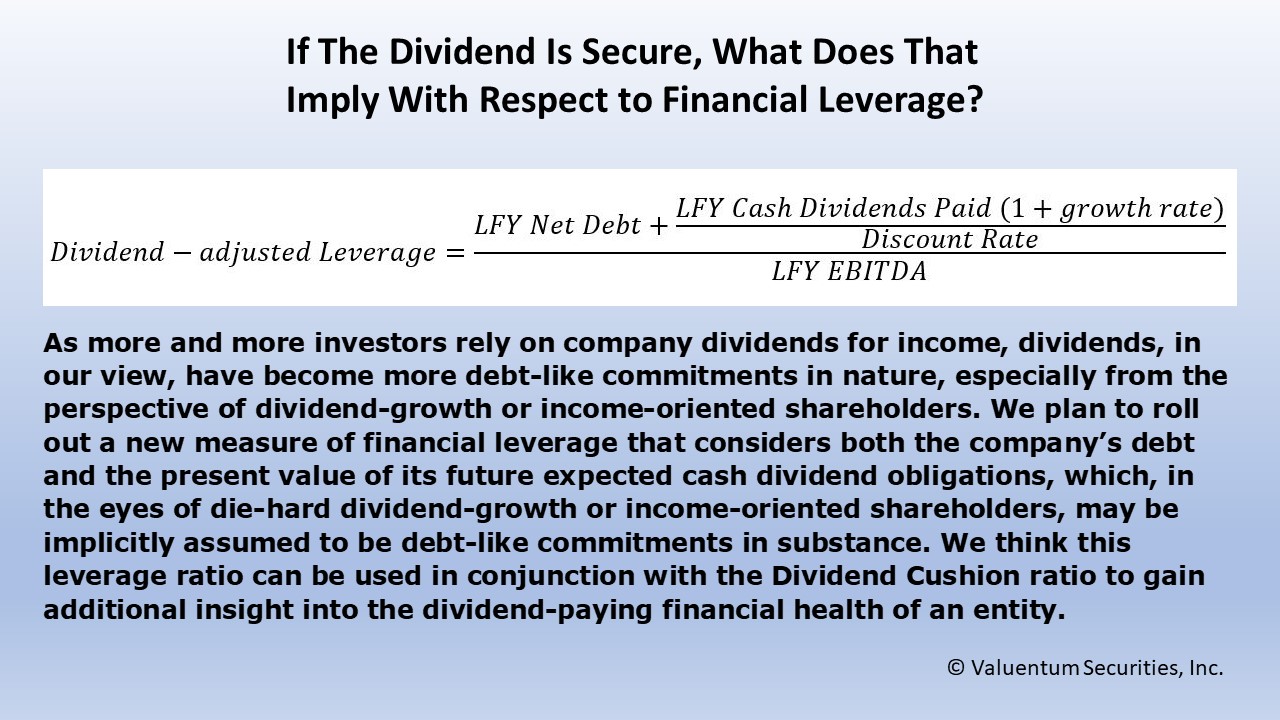
As more and more investors rely on company dividends for income, dividends, in our view, have become more debt-like commitments in nature, especially from the perspective of dividend-growth or income-oriented shareholders. Years ago, we rolled out a measure of financial leverage that considers both the company’s debt and the present value of its future expected cash dividend obligations, which, in the eyes of die-hard dividend-growth or income-oriented shareholders, may be implicitly assumed to be debt-like commitments in substance. We think this leverage ratio can be used in conjunction with the Dividend Cushion ratio to gain additional insight into the dividend-paying financial health of an entity.
Note: There is often great confusion with respect to published measures of financial leverage, and our intent with the creation of this leverage ratio is not to add to the confusion, but to help dividend growth and income-oriented investors think about what is implied in terms of leverage by their expectations that a company’s dividend is secure (and is anticipated to grow), as in the case of the dividend essentially being viewed as a cash commitment to shareholders/unitholders, which may often be the case for many dividend growth and income-oriented investors.
Typically, most reporting uses the credit-rating agencies’ leverage metrics or measures of leverage that are provided by the company. Depending on the stakeholder, however, the application of various measures of leverage may be helpful in painting a better picture of the risk to the dividend. Said plainly, this tool is to help the equity investor evaluate the financial risks of more-speculative dividend payers and raise awareness of what their views regarding the dividend imply with respect to leverage.
By Brian Nelson, CFA
Financial leverage is a very subjective consideration and can be measured in a variety of different ways depending on its relevance to a particular stakeholder, whether it be an equity holder or debt holder. Some measures of leverage include assets-to-equity as in the third product of the DuPont equation, for example, or total debt-to-EBITDA, or net debt-to-EBTIDA, or total debt-to-equity, among many others. Most leverage metrics, however, tend to focus more on assessing credit quality, as in evaluating the ability of a company to repay its debtholders, or in measuring and ranking the probability of default.
The credit rating agencies, for example, employ a wide variety of adjusted financial metrics that have myriad “subjective judgments” embedded within them. Moody’s, for example, uses debt-to-equity and debt-to-book-capitalization, as well as a unique measure called retained cash flow to net debt (RCF/net debt). The definitions for many credit metrics can be relatively complex, in some cases. For example, according to Moody’s, RCF/net debt decomposes into the following: (FFO-preferred dividends-common dividends-minority dividends) / (short-term debt + long-term debt, gross – cash and cash equivalents).
The ratio RCF/net debt is a rare credit metric, in our view, that may be applicable to that of the dividend growth or income investor. Where a bond holder may implicitly assume that dividends can be cut/reduced in order to shore up cash flow to service debt repayment, from the perspective of the equity investor (one that is counting on that dividend for income), the view is quite different. In the eyes of many die-hard dividend growth or income investors, for example, the dividend payment is often viewed, in great substance, as the equivalent of a debt-like cash commitment. RCF/net debt provides some context in how much cash flow is left over after paying dividends or distributions to service the debt, but it may not be a pure measure of dividend-adjusted leverage, as in the traditional sense (where EBITDA may be in the denominator, for example, as in net debt-to-adjusted EBITDA).
In any case, what we like about the RCF/net debt ratio is that it does not assume that dividends are not going to be paid, as in the case of other traditional credit metrics that effectively ignore the dividend or distribution as an important cash outflow (and an implicit reduction to credit quality). The RCF/net debt ratio assumes that the dividend is a debt-like cash commitment reducing funds from operations, something we believe is very relevant to the dividend growth or income-oriented shareholder that is depending heavily on that dividend or distribution payment. What RCF/net debt also considers is that the same money distributed to shareholders or unitholders is not also used twice as same money that can be used to service the debt (double counting). In our view, it should be generally assumed that such capital can only be used once; if it’s paid out as a dividend/distribution, it generally should not be assumed that it is also capital that can be used for debt repayment.
The idea of a new measure of leverage for dividend growth and income-oriented shareholders/unitholders that considers dividend/distribution obligations originated in the 2015 analysis of Kinder Morgan (KMI) when we explained how a dividend-growth or income-oriented investor that, if they are truly counting on the dividend/distribution to be paid in the future for their income stream, they should evaluate the company’s financial leverage in the context of both its net debt and the present value of those dividends/distributions to shareholders/unitholders. Once the capital corresponding to dividend payments is released to shareholders/unitholders, that same capital shouldn’t also be considered as a means to repay debt as well. Here’s what we said in that 2015 piece:
One of the dual and perhaps lesser-known benefits of the dividend discount model is that it seconds as a calculation of the present value of future cash dividend obligations. For example, the higher the “perceived” equity value that is supported by the dividend discount model, the more the present value of cash obligations the company has to shareholders, and by extension, the lower implicit credit quality of the organization, assuming a company continues to pay and increase its dividend...
In any case, what matters most is not the absolute level of the debt on Kinder Morgan’s books, which is striking by itself, but whether Kinder Morgan can service all of its debt-like, cash obligations with its own organically-generated EBITDA, which pays no mind to capital spending in any form. Kinder Morgan currently has $42.8 billion in debt, net of cash, on the balance sheet, and implicitly, on the basis of the price targets of some brokerage houses that employ a dividend discount model, it has another ~$100 billion in “mandatory” obligations to shareholders in the form of dividends (though if you ask a shareholder, the dividend payment is as contractual as it gets).
We think that, as the credit rating agencies evaluate the firm’s die-hard commitment to shareholders and its unwavering backing of an explosive future dividend growth plan, the implied leverage of cash, debt-like commitments at Kinder Morgan should approach $140 billion. The company’s reported Debt-to-EBITDA is 5.8 times, already a consideration for junk-rated credit status, but its implied Debt-to-EBITDA is closer to 19 times ($140 billion/$7.35 billion) after factoring in all cash, debt-like commitments…
We think the concept of financial leverage should be viewed differently as it relates to the perspective of either the debt holder or the dividend-growth and income-oriented equity holder. In the case of Kinder Morgan in 2015, for example, many holders of its stock were die-hard dividend growth investors, and they were counting on the company’s dividend no matter what. This assumption should be an important part of leverage analysis of that of the dividend growth and income investor. Looking at financial leverage from the perspective of that of a bold holder, or as one that assumes the company will cut its dividend to repay debt, may not be an accurate representation of actual cash, debt-like obligations in the eyes of dividend-growth or income-oriented shareholders, which are counting on the dividend to be paid through thick and thin.
Where RCF/net debt effectively reduces the numerator by dividends paid as a way to explain just how much cash is left over to service the debt, an implied measure of leverage that views dividends as cash, debt-like commitments may be of equal usefulness. We believe it makes little sense from the perspective of a dividend-growth or income-oriented shareholder to evaluate a company’s financial leverage as if one is never going to get paid a dividend or distribution! Financial leverage from the perspective of the dividend-growth or income-oriented shareholder should consider all net debt and the present value of all future expected dividend obligations. Much like rent can be capitalized to arrive at a present value of debt equivalent (as if a retailer were to finance a building instead of paying rent), dividends can be capitalized in much of the same way through either the construct of a dividend-discount model or through a growing perpetuity function with a reasonable discount rate.
The dividend-adjusted measure of leverage, or financial leverage as we think it should be viewed in the eyes of the dividend-growth and income-oriented investor, is as follows:
Valuentum rolled out this new dividend-adjusted leverage ratio in the fourth-quarter Data Screener, released October 1, 2018. We think this ratio--used in conjunction with the Dividend Cushion ratio--will provide even more insight into the dividend-paying financial health of the entity. We hope you continue to enjoy our proprietary data suite.
----------

Tickerized for holdings in the SPDR S&P Dividend ETF. This article originally appeared on our website July 12, 2018.
Brian Nelson owns shares in SPY, SCHG, QQQ, DIA, VOT, RSP, and IWM. Valuentum owns SPY, SCHG, QQQ, VOO, and DIA. Brian Nelson's household owns shares in HON, DIS, HAS, NKE, DIA, RSP, SCHG, QQQ, and VOO. Some of the other securities written about in this article may be included in Valuentum's simulated newsletter portfolios. Contact Valuentum for more information about its editorial policies.
Valuentum members have access to our 16-page stock reports, Valuentum Buying Index ratings, Dividend Cushion ratios, fair value estimates and ranges, dividend reports and more. Not a member? Subscribe today. The first 14 days are free.