5 Questions Answered by the Valuentum Team

Image Source: Eric
1. On the 16-page Reports
QUESTION: When I look at the company vitals information on the left side of the first part of each stock page, are the ‘Est. Normal Diluted EPS’ and ‘P/E on Est. Normal Diluted EPS’ essentially the same as 12-month forward EPS and 12-month forward P/E I see from other data sources (just worded differently and based on your estimates rather than “consensus figures”)? It seems like this would be the case, but I wanted to double check. Do you all back out the company’s net cash position when looking at this metric?
ANSWER: Our normalized P/E ratios and EV/EBITDA ratios consider the companies’ current price relative to the average earnings or average EBITDA over a reasonable forward-looking cycle, generally five years. For example, the ‘Est. Normal Diluted EPS’ will take the price at the time of the report and divide that by the average annual EPS over the next five years. The same process occurs with respect to the current price of EV (market cap plus book value of debt, preferred) divided by the average of annual EBITDA over the next five years.
The normalized measures are unique as they take into consideration our forecasts over the next five years within the context of our enterprise discounted cash flow process. The net cash position is not backed out of the ‘Est. Normal Diluted EPS.’ The net cash position is considered in our fair value estimate, namely the price-to-fair value (P/FV) ratio as well as in the context of enterprise value (EV), applied within the EV/EBITDA multiple, for example. – Brian Nelson, CFA
2. Zimmer Biomet
QUESTION: I wanted to ask you about your recent cautious update on Zimmer. I agree that operating income and cash flows came in weak this quarter. But the management commentary on the call was really positive (although there were no questions on cash flows). Zimmer, as you well know, has been struggling with their turnaround. But if the turnaround is about over, then their fundamentals should start to improve. I was thinking that we would finally start to see margin improvement over the next few years. This obviously isn't your take. Do you believe management isn't being sincere?
ANSWER: On October 2, we published a note (article link here) covering why the near-term outlook for Zimmer Biomet (ZBH) was less optimistic than management would have you believe. Here’s a slightly edited excerpt from the piece:
“Previous guidance for 2019 called for -0.5% to 0.5% annual revenue growth assuming a 100-150 basis point headwind from foreign currency headwinds… Now management expects the foreign currency headwind to come in at 125-175 basis points in 2019; however, Zimmer Biomet still raised its revenue growth guidance to flat to 0.5% growth.
Non-GAAP revenue was up 1% on a constant currency year-over-year basis during the first half of 2019, but down 1.5% on a GAAP basis when including foreign currency headwinds. It’s a little odd that management guided for stronger top line growth while assuming a larger foreign currency headwind considering the relatively weak sales performance during the first half of the year. Not out of the question by any means, but suspicious…
Management lowered Zimmer Biomet’s full-year adjusted (non-GAAP) operating profit margin expectation to 27.0-27.5% from 27.0-28.0% previously, while also lowering its expected adjusted tax rate by 50 basis points. Peculiarly, however, the company raised its full-year adjusted (non-GAAP) diluted EPS guidance to $7.75-$7.90 from $7.70-$7.90 previously…
…the company’s upwardly revised adjusted diluted EPS forecast for 2019 is entirely based on slightly stronger expected revenue growth (a forecast that looks a tad overly optimistic given weak first half performance and rising foreign currency headwinds) and a lower adjusted tax rate offsetting the negative impact of a lower expected operating profit margin. In particular, the lower adjusted expected tax rate is quite convenient and could be viewed as management front-loading certain tax shielding strategies in a bid to preserve Zimmer Biomet’s perceived near- and medium-term outlook.”
To reiterate our view, we think there’s a good chance management will deploy aggressive tax shielding efforts during the second half of 2019 to bolster Zimmer Biomet’s EPS this year by reducing its effective tax rate, but that doesn’t change the headwinds its business faces. For instance, the US Supreme Court on Monday October 7 struck down Zimmer Biomet’s request to appeal a $248 million judgement made against the firm. That ruling involved Zimmer Biomet infringing on some of the intellectual property of competitor Stryker Corporation (SYK) as it relates to patents covering surgical cleaning wands. The US Supreme Court opted not review the scope of the damages in the 2017 ruling, which was prompted by a 2010 lawsuit made by Stryker. There’s a chance that this legal development may embolden Stryker and other firms to file lawsuits against Zimmer Biomet in the future over patent infringement in the medical device space and that could threaten Zimmer Biomet’s future financial performance if the company has to pay firms like Stryker heft fees to use their patents.
When it comes to deleveraging efforts, that’s where Zimmer Biomet’s management has actually been very sincere. At the end of 2015, the company had a net debt load of $9.9 billion after Zimmer Holdings acquired Biomet. By the end of June 2019, Zimmer Biomet’s net debt load had fallen to $8.3 billion. However, we caution that the firm’s net operating cash flows have been rather weak this year. Additionally, please note that Zimmer Biomet’s GAAP operating profit dropped by almost a third from the second quarter of 2018 to the second quarter of 2019. That was largely due to rising SG&A expenses (total GAAP operating expenses climbed by 4% during this period, led by a 6% increase in SG&A expenses) and shrinking revenues.
Our models forecast strong EBIT margin growth at Zimmer Biomet over the next five years as well as modest revenue growth, so we’ve already captured the expected turnaround management sees in Zimmer Biomet’s performance going forward (consensus estimates indicate the market expects the firm’s revenue growth to begin recovering in 2020). Even when factoring in that turnaround, shares of ZBH look generously valued to us given the headwinds its business faces (from foreign currency headwinds to rising operating expenses to legal rulings negatively impacting its balance sheet and potentially its business model). Our fair value estimate for Zimmer Biomet stands at $118 per share and the top end of our fair value estimate range sits at $142 per share, with ZBH trading at $133.42 per share as of the market close on October 9. We are still staying away from ZBH.
Please note that we recently updated our models for the medical devices industry, and readers can access Zimmer Biomet’s new 16-page Stock Report here---->>>>. -- Callum Turcan
3. About International and Emerging Markets Exposure
QUESTION: It is clear that our individual equity portfolios have done fantastic by applying Valuentum principles like enterprise valuation, dividend cushion etc. To further diversify portfolios, we incorporated some international, emerging markets and small cap funds--not a huge weighting to these areas, but maybe 10-20% of portfolios. These allocations have not done nearly as well. My question for you is you do not seem to advocate for a strategic allocation to developed/EM/US small cap stocks. Every investment conference I attend, the most consistent message is that allocating to these areas is super important--they say the US stocks like in Valuentum newsletter portfolios have been on a nice run but you need to diversify outside of the US. These stocks are overpriced relative to the rest of the world, carry elevated antitrust risk; plus, it’s not wise to have too much of a home country bias. What’s your take on this line of thinking?
ANSWER: We recently talked about the 60-40 stock-bond allocation (https://www.valuentum.com/articles/Economic_Commentary_US-Listed_Chinese_Names_60-40_Stock-Bond_Allocation_and_More), but we generally believe that within any allocation across any asset class that assessing the intrinsic value of the assets owned relative to their observed price is an informative process. Modern portfolio theory may suggest greater international diversification at any price, but without adequate due diligence and a price-to-fair value process, this could result in just adding overpriced assets to a broader portfolio, which could hurt long-term returns, instead of augmenting them. – Brian Nelson, CFA
4. Verizon
QUESTION: Your summary of VZ shows a dividend cushion of 0.1, yet free cash flow seems to approximate earnings per share. If so, then the Dividend Cushion ratio would appear to be 1.56 based on EPS of $3.83? Can you explain how you come up with such a low Dividend Cushion ratio?
ANSWER: Verizon Communications (VZ) has a strong free cash flow profile, but we caution that its enormous debt load represents the biggest reason why its Dividend Cushion ratio is so low at 0.1x. Our Dividend Cushion ratio is based on the forecasted net operating cash flows of the firm over the next five full fiscal years, less expected capital expenditures during this period (effectively the company’s expected free cash flows during this period), less the net debt (or plus the net cash) position of the firm at the end of its most recent fiscal year, dividend by the expected total dividend payout during this period. The graphic below highlights this dynamic for Verizon Communications, and please note its two-page Dividend Report can be accessed here---->>>>. -- Callum Turcan
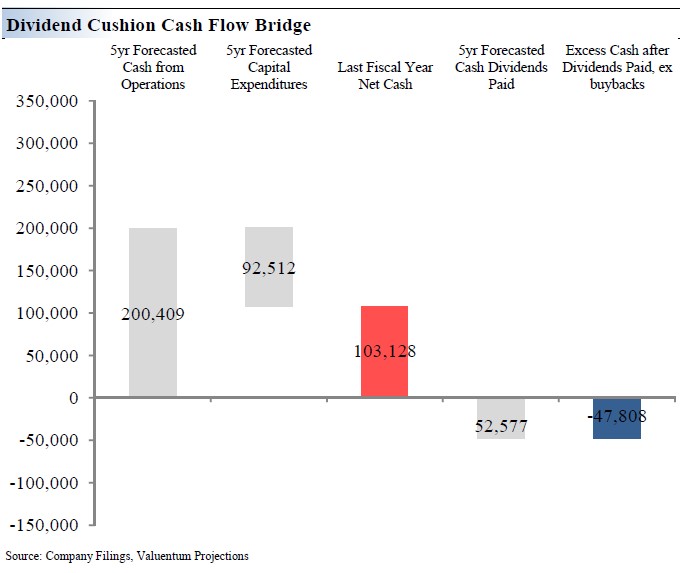
Image Shown: Verizon’s Dividend Cushion ratio is weak because of the firm’s large net cash debt and sizable expected capital expenditures, a product of the telecommunications giant getting ready to rollout out 5G infrastructure across the US.
<< Read More about the Calculation of the Dividend Cushion ratio
5. About the Quant Value and Size Factors
QUESTION: There seems to be some diversification benefit over the last 30 years to incorporating international investments, but this has diminished over time. Moreover, SmB (size) factor is negative for S&P 500 over 30 years and HmL (value) is flat. Seems like these are better in small cap, EM and REITs, but kind of interesting.
ANSWER: We generally don’t view equities in the context of realized ambiguous factors as in the HmL book-to-market ratio, for example. Our take is that the traditional quant value factor is spurious/random, and there has been additional research showing that the size effect really does not exist (https://www.aqr.com/Insights/Perspectives/It-Aint-What-You-Dont-Know-That-Gets-You-Into-Trouble). From our perspective, both the CAPM and three-factor models have failed, bringing into question the entire foundation of quantitative thinking. We have very little confidence that any factor or anomaly based on realized, ambiguous data will continue into the future. Our confidence rests in enterprise valuation (free cash flow to the firm process) and the resulting price-to-fair value (P/FV) metric coupled with a technical/momentum overlay. – Brian Nelson, CFA
Disclosure: Callum Turcan and Brian Nelson, CFA do not own any of the securities mentioned in the article above.
1 Comments Posted Leave a comment