Still Bullish -- Stocks for the Long Run!
Excuses not to pick stocks are only exposing biases these days.
By Brian Nelson, CFA
The S&P 500 (SPY), Dow Jones Industrial Average (DIA) and Nasdaq (QQQ) continue to hover near all-time highs, and all appears well. We maintain our bullish take on the markets and believe that we are in the early innings of a long bull market that started following the washout March 2020 during the depths of the COVID-19 meltdown.
Stock bull markets tend to average about 4.4 years in duration, with the last one enduring ~11 years, while bear markets are very abrupt, lasting only 11.3 months on average, the last one a very short 1.1 months, according to data from First Trust. We’re about 15 months into this new stock bull market, and we continue to believe increased equity exposure may better serve investors of all types going forward, through both the best of times and the worst of times.
Poor Advice Continues to Hurt Investors
The indexing boom continues to hurt, not help, investors. Holdings-based fund analysis that compares active management to itself has driven many away from active stock selection, the latter proving to be a tremendously lucrative strategy since the inception of Valuentum. For example, a 60/40 indexed and rebalanced stock/bond portfolio, as measured by the VBINX, trailed S&P 500 companies, as measured by the SPY, by roughly 130 percentage points the past 10 years, while offering little in the way of diversification benefits during COVID-19, the worst crisis since the Great Depression.
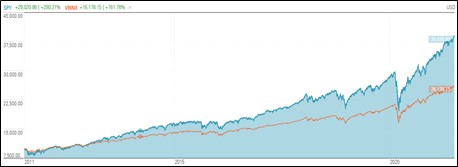
Image shown: S&P 500 companies have vastly outperformed the traditional 60/40 stock/bond portfolio during the past 10 years by a margin of about 130 percentage points. Image source: Morningstar
We believe almost all investors can do a better job with individual stock selection than the very tired advice of the 60/40 indexed and rebalanced stock/bond portfolio that also may come with hefty financial advisor fees. The 130 percentage points of underperformance of the 60/40 stock/bond portfolio relative to the SPY during the past 10 years is on a gross basis (before financial advisor fees)--and when netted for advisor fees is even worse--perhaps worse than an individual that just blindly bought and held a diversified selection of S&P 500 companies after throwing darts at the WSJ pages.
In this context, how can there possibly be rules in the financial industry called “Best Interest” when advisors can underperform stock selection this badly the past 10 years--and some still advise against diversified and prudent stock picking, or worse, not pursue it themselves for their clients in light of this evidence. Much will change in this industry, and the great index fund fee heist will be exposed once reason takes hold. Investors simply do not have to beat the market to do better than some of the widely accepted conventional wisdom out there. They just need to find the right perspective.
Many of our advisor clients truly put clients’ best interests first and I applaud them, and I’m proud to work with them. They work hard in identifying mispricings across the market to capitalize and manage risks within what has traditionally been the best-performing asset class: equities. Many understand that diversified stock selection is as much a risk management process as the periodic auto-rebalancing of various assets, and that true benchmarks for risk management processes should be measured on an apples-to-apples basis against the same benchmark, in this case perhaps S&P 500 companies, market weight or equal weight.
Imagine holding a 5-star 60/40 stock/bond fund and think you're doing well. Yikes.
Fixed Income Yields Expose MPT Mirage
Modern portfolio theory (MPT) and the 60/40 stock/bond allocation may have had its day when Treasury yields were 15%+ in 1980 and bond yields were much higher. History supports this. For the period 1973-1992, a portfolio consisting of one quarter U.S. large stocks, U.S. small stocks, foreign stocks, and U.S. high quality bonds had a higher return with lower volatility than S&P 500 companies. But that’s mostly because Treasuries were yielding in the double digits during this time period. Treasuries.
This clearly is not 1973. Nixon is not President. Elvis Presley is not entertaining in Hawaii. Secretariat is not the reigning Triple Crown Winner. George Foreman is not the World Heavy Weight Boxing Champ. I’m not going to insult your intelligence. You get the point. This is 2021, and the 10-year Treasury is less than 1.3% today.
MPT came of age during the 1990s following research that studied abnormally high fixed-income yields that would never be repeated. It has been a tragedy since, costing investors a percentage point and a half per year relative to S&P 500 companies during the following 30 years beginning in the early 1990s – and this underperformance doesn’t include the annual financial advisor fees that were levied on to the 60/40 indexed and rebalanced portfolio each year during this time.
The individual investor is getting screwed.
Indexing and auto-rebalancing have become an abomination and have cost investors more than anything else in the history of finance, in my view. Too many research firms are letting the tail wag the dog, telling investors (and advisors) what they want to hear, providing conflicted research. Here's the real deal: Stocks and bonds were highly correlated during the COVID-19 swoon and saved investors little during the health crisis while costing them dearly during the massive bull market in the decade that preceded it.
The Value vs Growth Conversation Is Nonsense
With our position in favor of equity investing clearly noted, the internals of the U.S. stock markets remain healthy. Big cap tech and large cap growth soared during the second quarter of 2021, and while small cap value experienced a dead-cat bounce during the first quarter, we believe big cap tech and large cap growth remain the places to be--not because of what has happened in the past of course, but because we’re huge fans of the moaty, undervalued, net-cash-rich, secular growth, and free-cash-flow generating powerhouses that make up large cap growth's exposure: Apple (AAPL), Microsoft (MSFT), Facebook (FB), Alphabet (GOOG) (GOOGL), Visa (V), and UnitedHealth Group (UNH), to name a few.
Meanwhile, small cap value, as measured by the IWN, ironically includes meme-favorite AMC Entertainment (AMC) as its top weighting, as of July 7. The high weighting of this irrationally overvalued stock in a "value" ETF is yet more evidence of how ridiculous the growth-versus-value conversation has become, a theme we laboriously laid out in the book Value Trap. Reddit and WallStreetBets’ favorite GameStop (GME) had been the top weighting in the IWN as of June, followed by AMC Entertainment. If these weightings of overpriced stocks in small cap value don’t show you the absolute abomination that is the study of growth-versus-value then nothing will, my friends.
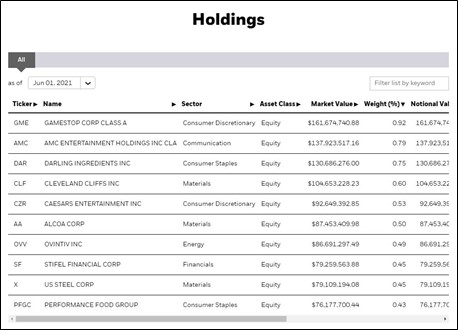
Image shown: The top holdings of the iShares Russell 2000 Value ETF, as of June 1. Quantitative value, for all intents and purposes, has become meme-stock oriented, further supporting the nonsensical nature of separating stocks with the labels of value versus growth. Image source: iShares.
For those that are new, Valuentum was founded on the important concept of putting investors’ first, not selling large fees on index funds supported by failed MPT or trying to convince investors through “psydo-science” and "bafflemath" that there are growth and value stocks when there are not. There are only undervalued, fairly valued, and overvalued stocks, and it’s the fiducuary's duty to do their best to sort them accordingly, not say that GME and AMC are correctly priced when they are moving around 10%, 20%, 50% the same day on no news.
Valuentum’s founding principle rests on the following Warren Buffett quote:
But how, you will ask, does one decide what [stocks are] "attractive"? Most analysts feel they must choose between two approaches customarily thought to be in opposition: "value" and "growth,"...We view that as fuzzy thinking...Growth is always a component of value [and] the very term "value investing" is redundant. -- Warren Buffett, Berkshire Hathaway annual report, 1992
We’ve built and executed on a methodology that embraces these concepts. The Valuentum Buying Index offers a process to highlight new ideas for consideration, while the fair value estimate process shows that low P/E stocks can be overvalued, while high P/E stocks can be undervalued. Valuation is a function of the net cash on the balance sheet and future expected free cash flows, not a single-year snapshot multiple that does not consider cash-flow duration. To a large extent, the financial industry in its advanced quant analysis is most adept at publishing spurious correlations, it would seem.
Inflation Risks Overblown, Fixed Income Yields Paltry
We’re not concerned about the risks of inflation. Most of the inflation we’ve witnessed has been limited to areas such as lumber and used cars due to temporary shortages or supply chain disruptions, and these areas are already starting to cool off. However, we think increased money supply will continue to find its way into the equity markets, as there remains over $4 trillion just sitting in money market funds, according to Bloomberg. It will take years for this excess liquidity to be deployed, offering support to markets to the upside, in our view, perhaps helping to replay the bull market of the last decade, we hope.
We thought it prudent for savvy investors to consider dollar-cost averaging into the market during the March 2020 swoon, and in the simulated newsletter portfolios, we went “all in” to equities in April 2020 in lockstep with one of the best bull markets in history. Shortly after in June 2020, with the market trading at ~3,000, we pegged a fair value estimate range of the S&P 500 at the high end of 3,920. People thought we were crazy at the time, but the only thing that we were was right. Assuming the time value of money and a conservative 10% WACC on the 3,920, a fair value today for the S&P 500 at the high end stands almost exactly where it’s trading, or about 4,312.
But much has changed since June 2020. Entities such as Facebook and Google continue to be vastly underpriced, while we’re finally getting some life out of the banks (XLF) and energy (XLE) sectors thanks to better net interest margin expectations and higher energy resource prices. The 10-year Treasury now stands at a measly ~1.3% and the BofA US High Yield Index Effective Yield is now ~3.92%. Fixed income yields are paltry, and those continuing to pursue MPT with a bond allocation may continue to suffer relative to equities in the decades ahead.
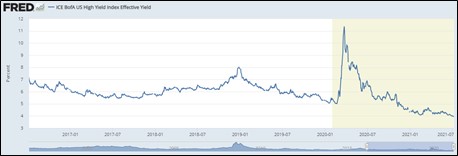
Image shown: The ICE BofA US High Yield Index Effective Yield is now ~3.92%. It measures the performance of US dollar denominated below investment grade rated corporate debt publicly issued in the US domestic market. Image source: FRED.
Those that will pass their wealth to beneficiaries that will live for decades after them and those with indefinite lives such as pensions or endowments may do well to abandon MPT and instead internalize active stock selection. After all, brokerage commissions on equities are free, even cheaper than the lauded index funds that charge several basis points per year to momentum-trade stocks like GME and AMC as they are added to indexes. Excuses not to pick stocks are only exposing biases these days.
Dividend Growth to Capture Capital from Fixed Income
Falling interest rates are positive for equity valuations, in general, and the lack of reasonable yield opportunities with respect to bonds, means that dividend growth options have become much more attractive, too – all pointing to more and more buying within equities as this new decade starts to take shape. For example, the 30-Day SEC Yield on the SPDR Portfolio S&P 500 High Dividend ETF (SPYD) of 3.95% is now greater than the yield of US dollar denominated below-investment grade rated corporate debt.
Dividend growth remains powerful, and we recently added ExxonMobil (XOM) and Chevron (CVX) to both the Best Ideas Newsletter and Dividend Growth Newsletter portfolios recently. ExxonMobil yields ~5.8% while Chevron yields ~5.2%, and both will benefit from higher realized energy resource prices in the back half of 2021 if current prices hold, which we think they will in light of strong liquidity and the ongoing re-opening of the global economy.
The case for equities remains strong for long-term capital appreciation and for dividend growth to gradually take share against fixed income, but there are still risks, of course. Many are concerned about variants of COVID, but I feel the health community has the capacity to roll out new and improved vaccines, if needed. This is just a temporary issue. I don’t think any tax policy change will hurt the markets either, as Biden’s tax plan may be “losing momentum,” though I applaud his efforts to make community college free to all.
Others are concerned about runaway inflation, but the market is indicating that inflation is not a worry, with the 10-year Treasury falling quite a bit since the near-term highs of ~1.75% it set in March of this year--and if inflation translates into pricing power for many of our equity ideas, then it is a net positive. We’ve already seen some of the strongest companies raise prices the past few months, including PayPal (PYPL) and Chipotle (CMG), and we expect this theme to continue whether meaningful inflation comes or not. That either means stronger nominal earnings, or stronger earnings growth, both positive for intrinsic value estimates.
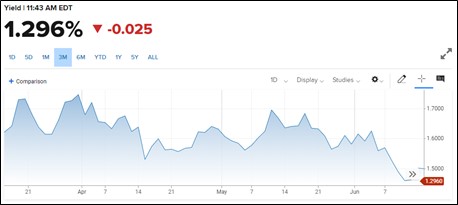
Image shown: The 10-year Treasury rate has fallen quite a bit since March of this year, suggesting that inflation expectations have come down in recent months. Image source: CNBC.
The alternative asset market is not as robust as it used to be with collectors’ items coming in a bit since earlier this year, but it still remains robust. Sports card values are still setting all-time records, with a Steph Curry Rookie Logoman going for $5.9 million recently, and Bitcoin is still hovering north of $30,000. Real estate and residential housing remain robust with housing prices continuing to climb. Many listing their houses are receiving above-market bids and several of them, as consumers reevaluate their living and working quarters at home following shut down orders as a result of COVID-19. We expect housing prices to increase for years as this trend plays out.
According to FactSet, earnings growth for the second quarter of 2021 is on track to be the best since the fourth quarter of 2009, though we note that both periods reflect a huge bounce back from crises, the COVID-19 meltdown and the Great Financial Crisis, respectively. ExxonMobil and Chevron have been the largest contributors to earnings growth within the energy sector, while the airlines have bounced back to help lead industrials. The 12-month forward P/E on the S&P 500 remains a bit elevated, but earnings expectations have yet to catch up to an economy that is coiled to spring higher, and many companies are finally fetching the multiples they have deserved for years.
Wrapping Things Up
As we wrap up, we’d like to see an environment where 1) manageable inflation drives strong pricing power translating into continued solid earnings growth at S&P 500 companies, 2) the 10-year Treasury continues to fall towards zero, but stays positive (so as to not disrupt investor sentiment, as discount rates will remain positive due to equity risk premiums even if the risk-free-rate goes negative), 3) housing and equity prices continue to advance, padding the wealth effect and driving a virtuous cycle of higher demand and higher prices, 4) an asset allocation cycle into equities as fixed income becomes incrementally less attractive as yields fall, 5) an easement of health and political risks in the coming years, namely COVID variants and corporate tax policy, and 6) ongoing resilience of alternate assets from collectibles to cryptocurrencies and beyond that recycle incremental capital into equity and housing prices.
All in all, we continue to believe the newsletter portfolios are well-positioned. We’re still bullish. Stocks for the long run!
-----
Treasury-related ETFs: TLT, TBT, IEF, SHY, EDV, IEI, TMV, TMF, VGSH, VGLT, TBF, BIL, SHV, GSY, SPTL, VGIT, GOVT, SCHO, TTT, ZROZ, TLH, SCHR, PST, GBIL, SPTS, TYD, UBT, PLW, TYO, UST, USFR, TBX, SPTI, VUSTX, DTYS, TFLO, EGF, VRIG, FLAT, TAPR, DFVL, DFVS, SCHQ, STPP, CLTL, FIBR, DTUS, USTB, DTYL, SGOV, DLBL-OLD, BBSA, DTUL, OPER, GOVZ, AWTM, TFJL, TBJL, BILS, FLGV, BTYS, FATT, IBTK
Housing related: HD, LOW, LL, ITB, DHI, PHM, TOL, LEN, BZH, KBH, MTH, SHW, MAS, OC, XHB, NAIL, HOMZ, PKB, NVR
Related bank/Bitcoin/alternative: KRE, KBE, GBTC, COIN, MUDS
Related airlines: JETS, ALK, LUV, AAL, ACDVF, DAL, UAL, HA, SAVE, GOL, CPA, RYAAY, SKYW, MESA

-----
Image Source: Value Trap
----------
Valuentum members have access to our 16-page stock reports, Valuentum Buying Index ratings, Dividend Cushion ratios, fair value estimates and ranges, dividend reports and more. Not a member? Subscribe today. The first 14 days are free.
Brian Nelson owns shares in SPY, SCHG, QQQ, DIA, VOT, and IWM. Brian Nelson's household owns shares in HON, DIS, HAS. Valuentum owns shares in VOO, SCHG, DIA, and QQQ. Some of the other securities written about in this article may be included in Valuentum's simulated newsletter portfolios. Contact Valuentum for more information about its editorial policies.
3 Comments Posted Leave a comment