Proctor & Gamble Pushes Forward
Image Source: Procter & Gamble Company – Third Quarter Fiscal 2020 Earnings IR Presentation
By Callum Turcan
On April 17, Procter & Gamble (PG) reported third-quarter fiscal 2020 earnings (period ended March 31, 2020) that beat consensus estimates on the bottom-line but missed consensus top-line estimates. Most importantly, Procter & Gamble showcased strong organic growth (organic volumes were up 6% company-wide year-over-year) as its ‘Health Care’, ‘Fabric & Home Care’, and ‘Baby, Feminine & Family Care’ segments posted 7%, 8%, and 6% net sales growth, respectively, on a year-over-year basis. Strong high-single-digit volume growth was key to offsetting unfavorable foreign currency headwinds at those three segments. Procter & Gamble’s ‘Beauty’ and ‘Grooming’ segments posted mild net sales declines on a year-over-year basis due to unfavorable foreign currency headwinds and unfavorable product mix shifts.
Earnings Overview
On a GAAP basis, Procter & Gamble’s net sales grew by 5% year-over-year last quarter, while its GAAP cost of goods sold rose by just 3%, allowing for nice gross margin expansion (up over 55 basis points). The firm’s GAAP diluted EPS rose 8% year-over-year, hitting $1.12, aided by a modest reduction its Procter & Gamble’s outstanding share count due to its ongoing share buyback program. Here’s what management had to say regarding Procter & Gamble’s strong organic sales growth during the firm’s latest quarterly conference call:
“At CAGNY, we were internally projecting Q3 organic sales growth for the Company of around 2%, we delivered 6% with 9 of 10 categories growing organic sales. We built aggregate share, despite temporary out-of-stocks in some of our highest demand items. While we don’t have final U.S. all-outlet share through March, share results and track channels through March show broad-based growth. Vicks respiratory products were up more than 4 points, Metamucil and Pepto-Bismol up 3 points. Olay moisturizers and Oral-B power toothbrushes up more than 2 points; Always Pads Always Discreet, Tampax, Tide, Dawn, Cascade and Gillette blades and razors each up 1 point or more; Pantene, Head & Shoulders, Old Spice, Native, Secret, Crest, Mr. Clean, Gain and Bounce, each growing share.
As you can see in the track channel data, our share declined recently in Baby and Family Care categories, due largely to out-of-stocks on our high demand brands. We’re pushing production to its limits but we expect share softness to continue while consumer pantry stocking remains at extreme levels. In China, we built share in offline stores and in e-commerce. Safeguard and Gillette delivered strong share performance in both channels. Head & Shoulders is particularly strong offline in a way [and] Whisper and Pampers posted solid online share growth.”
It appears Procter & Gamble was successful in growing its market share in several key consumer staples categories last quarter, which played a key role in bolstering its financial performance.
Financial Overview
Procter & Gamble ended March 2020 with $15.4 billion in cash and cash equivalents on hand versus $12.7 billion in short-term debt and $23.3 billion in long-term debt. While its near-term debt maturities are manageable given its large cash pile, its net debt load will make handling the ongoing coronavirus (‘COVID-19’) pandemic a trickier task. However, management remains confident in Procter & Gamble’s financial performance, and on April 14, the firm boosted its quarterly dividend by 6% sequentially, marking the firm’s 64th annual consecutive dividend increase. Shares of PG now yield ~2.6% on a forward-looking basis as of this writing.
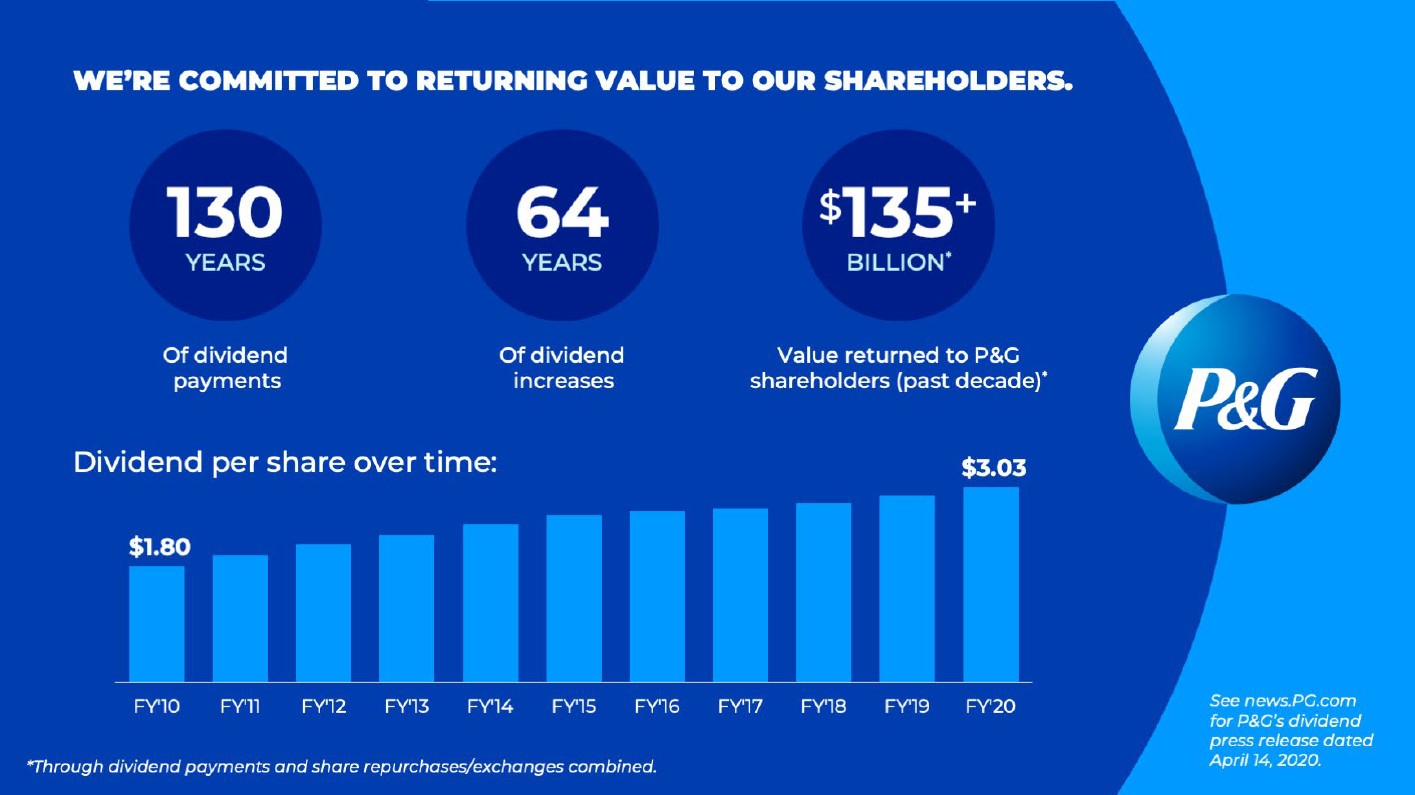
Image Shown: Procter & Gamble maintains its status as a Dividend Aristocrat. Image Source: Proctor & Gamble – Third Quarter Fiscal 2020 Earnings IR Presentation
The firm did not provide a cash flow statement within its earnings press release, but Procter & Gamble did note in the press release that it generated almost $4.1 billion in operating cash flow and spent over $0.7 billion on capital expenditures last quarter, allowing for ~$3.35 billion in free cash flow with a free cash flow conversion rate of 113%. We appreciate free cash flow conversion rates north of 100%, as that indicates the firm is doing a quality job converting earnings into free cash flow that can be used to reward investors via dividends and share repurchases.
Guidance
Management’s guidance for Procter & Gamble’s fiscal 2020 still calls for 4%-5% organic sales growth. While the company's organic sales in Greater China turned negative in the third quarter fiscal 2020, hitting -8% (negative 8%) year-over-year, its organic sales growth in the US climbed up to 10% due in part to the “panic buying” that took place once the pandemic started to spread worldwide. Additionally, Procter & Gamble reported strong organic sales growth in Canada (up 14% year-over-year), Latin America (up 11% year-over-year), and Europe (up 6% in its “focus markets” and 15% in its “enterprise markets” year-over-year) last quarter.
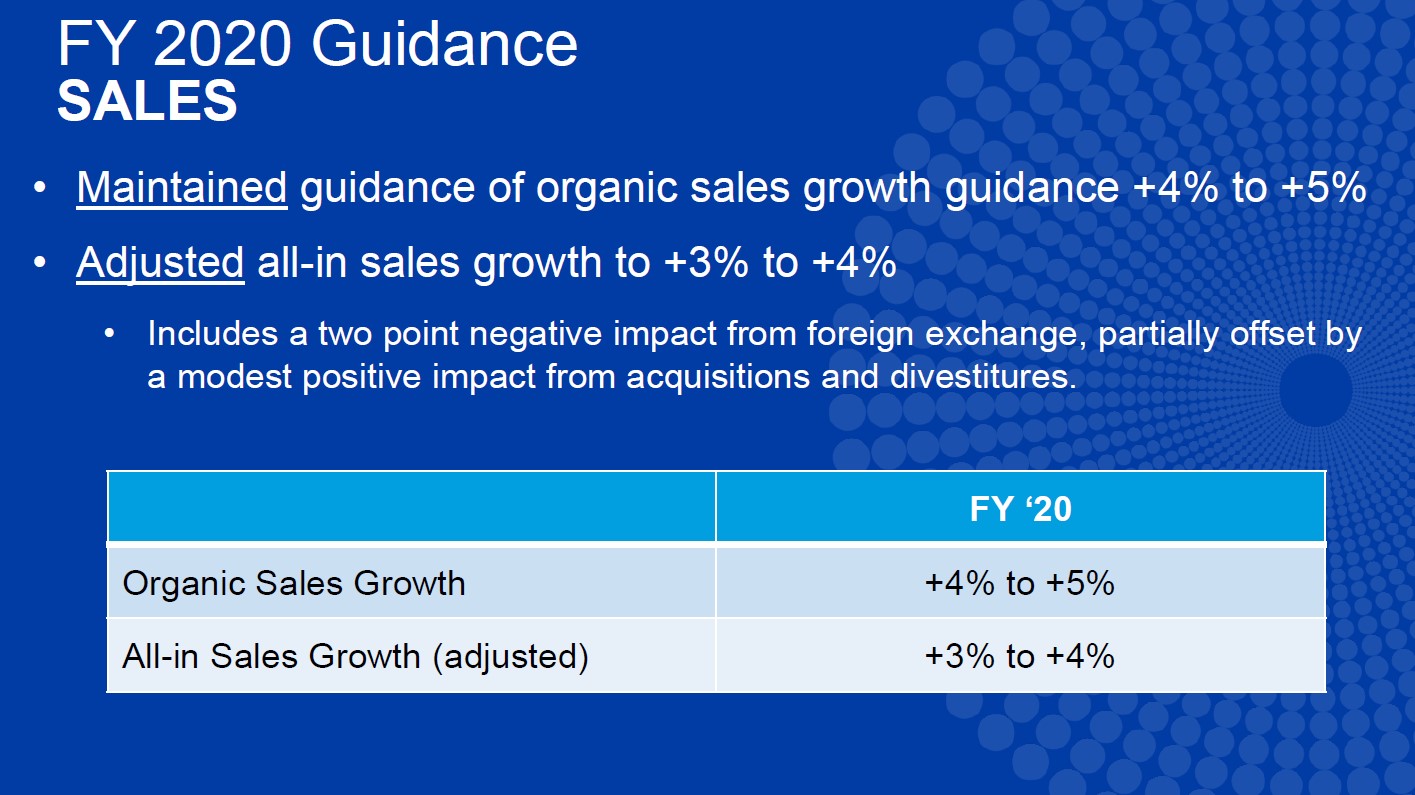
Image Shown: Procter & Gamble is guiding for continued strong organic and sales growth for the remainder of its fiscal 2020. Image Source: Procter & Gamble – Third Quarter Fiscal 2020 Earnings IR Presentation
Concluding Thoughts
Procter & Gamble’s strong showing during the third quarter of its fiscal 2020 and its favorable guidance for the remainder of the fiscal year highlights that demand for consumer staples products around the world is holding up quite nicely. As it relates to Procter & Gamble’s Chinese operations, those sales will likely rebound as China has since restarted large parts of its economy. Management mentioned that Procter & Gamble’s Chinese business is “rebounding nicely, both from an operations standpoint and from a consumption standpoint” during the firm’s latest quarterly conference call with investors.
-----
Household Products Industry – CHD CLX CL ENR HELE JNJ KMB PG
Related: CHIS, XLP
-----
Valuentum members have access to our 16-page stock reports, Valuentum Buying Index ratings, Dividend Cushion ratios, fair value estimates and ranges, dividend reports and more. Not a member? Subscribe today. The first 14 days are free.
Callum Turcan does not own shares in any of the securities mentioned above. Johnson & Johnson (JNJ) is included in Valuentum’s simulated Best Ideas Newsletter portfolio. Johnson & Johnson is also included in Valuentum’s simulated Dividend Growth Newsletter portfolio. Some of the other companies written about in this article may be included in Valuentum's simulated newsletter portfolios. Contact Valuentum for more information about its editorial policies.
0 Comments Posted Leave a comment