Papa John’s Posts Stellar Comparable Store Sales Growth
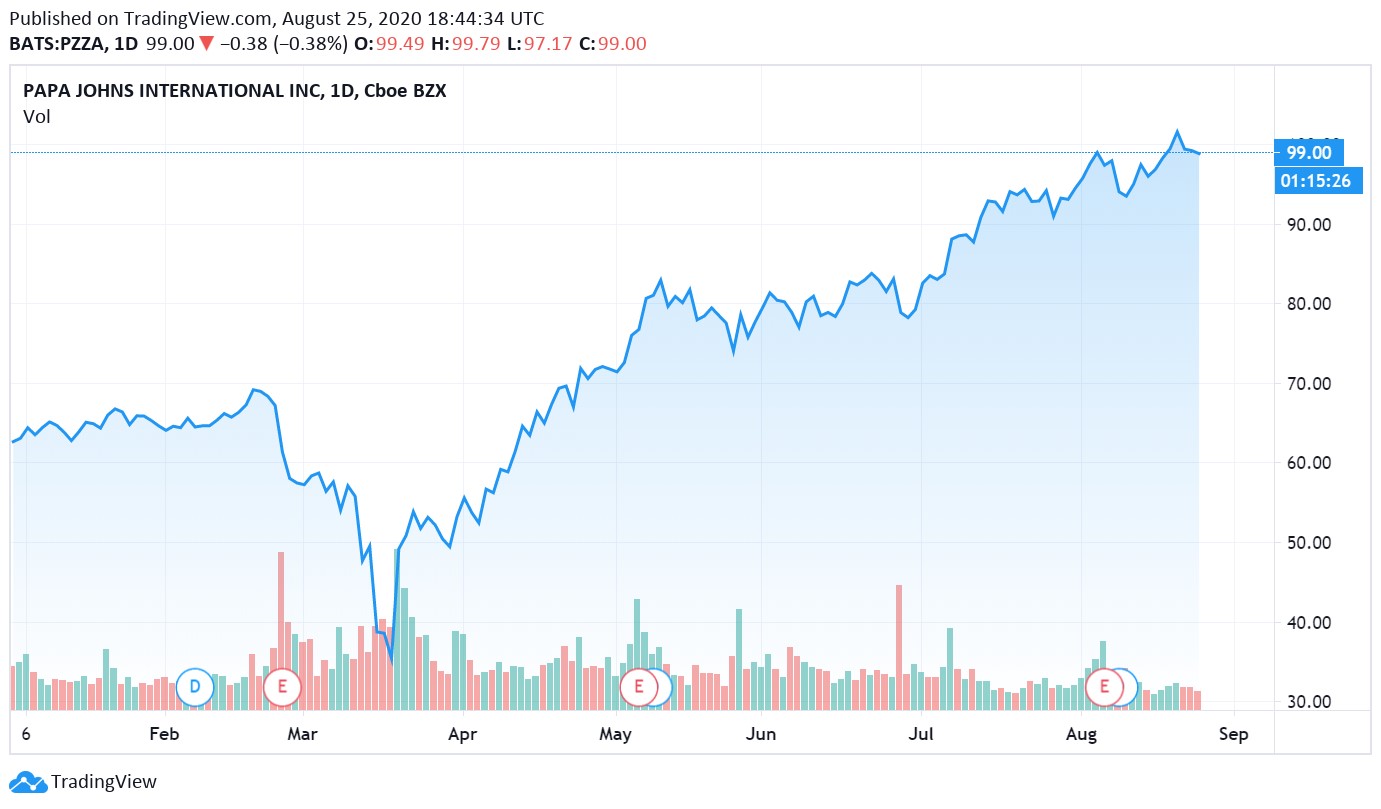
Image Shown: Shares of Papa John’s International Inc have surged upwards year-to date as of this writing.
By Callum Turcan
One company that has proven to be very resilient during the ongoing coronavirus (‘COVID-19’) pandemic is Papa John’s International Inc (PZZA). We significantly raised our fair value estimate for shares of PZZA back in June 2020 (link to the firm’s 16-page Stock Report here). As of this writing, Papa John’s is trading right at the top of our fair value estimate range which sits at $99 per share of PZZA. The company has an asset-light business model and a quality cash flow profile, a product of its focus on franchise operations, though Papa John’s does own some of its store locations.
As of December 29, 2019, Papa John’s had 5,395 restaurant locations worldwide operating in 49 countries and territories. Out of those locations, ~89% were franchised and the rest were either owned by the company or by a joint-venture the company had an economic stake in. Papa John’s success largely stems from past major investments in its digital presence and a heavy focus on home delivery and carryout offerings. With the pandemic forcing households to stay in and many restaurants to close, Papa John’s rose to the occasion to meet rising consumer demand.
Strong Sales Performance
During the first quarter of fiscal 2020 (period ended March 29, 2020), Papa John’s reported that its systemwide (company-owned and franchised) North American (defined as Canada and the US) operations posted a 5.3% year-over-year increase in comparable store sales. The company’s system-wide international operations reported that its comparable store sales rose by 2.3% year-over-year during this period. The company reported a 3% year-over-year increase in its GAAP revenues in the fiscal first quarter.
Pivoting now to Papa John’s second quarter of fiscal 2020 performance (period ended June 28, 2020), the firm’s system-wide North American operations reported a 28.0% year-over-year increase in comparable store sales while its system-wide international operations reported a 5.3% year-over-year increase in comparable store sales. Papa John’s reported its GAAP revenues rose by 15% year-over-year in the fiscal second quarter, a significant improvement versus its fiscal first quarter performance (meaning the firm’s revenue growth rate improved sequentially).
The company has also been providing interim updates on its sales performance. From July 27 to August 23, Papa John’s reported that its system-wide North American operations posted a 24.2% year-over-year increase in comparable store sales while its system-wide international operations posted a 23.3% year-over-year increase in comparable store sales.
As of August 23, ~150 of Papa John’s locations were temporarily closed, namely in Europe and Latin America, though its system-wide international comparable store sales performance includes that impact. Excluding those locations, Papa John’s system-wide international comparable store sales would have been up ~25% year-over-year during the July 27 to August 23 period (versus a little over 23% as covered previously).
We want to stress that Papa John’s comparable store sales growth trajectory appears to have continued into late August (and possibly beyond). That is likely why shares of PZZA have been on an upward tear since bottoming in March 2020, with shares of PZZA currently trading near all-time highs.
Online Focus
During Papa John’s fiscal second quarter earnings call, management noted that ~70% of the company’s orders were received through digital channels. Orders placed on mobile devices remains Papa John’s fastest growing segment according to management commentary (emphasis added):
“Part of our competitive advantage in the restaurant marketplace is that we are an e-commerce business. Approximately 70% of our orders are placed on digital channels, and mobile ordering is our fastest growing platform… [T]his capability positions us well for the foreseeable future as customer ordering and consumption behavior continues to be affected by the pandemic, possibly with long-term impact. In addition, our progress on the utilization of our loyalty and one-to-one marketing platforms is accelerating our growth. But how we leverage technology does not stop at our front door.
We have built strong relationships with external technology companies that allow us to meet the needs of more customers than we could alone. Papa John's robust partnerships with 3 of the 4 top delivery aggregators already in place before the pandemic have further enabled us to meet surging customer demand, especially during peak times when our delivery teams are working at full capacity. In fact, the percentage of our transactions delivered by aggregators was up more than 100% in Q2 versus Q1. These transactions are highly incremental and profitable to our business. As we have said repeatedly, Papa John's strategy is to win by providing our customers with better pizza wherever they are and however they choose to order.” --- Robert Lynch, President and CEO of Papa John’s as of August 2019
It appears that Papa John’s strategy is paying off given its strong sales performance this calendar year. When management refers to delivery aggregators, that includes firms like GrubHub Inc (GRUB). Utilizing delivery aggregators helped Papa John’s avoid capacity constraints and better enabled the firm to meet rising consumer demand at a crucial time for its business (keeping its past troubles regarding the founder of Papa John’s in mind). To keep the momentum going, Papa John’s recently launched a “Shaq-a-Roni” pizza offering in partnership with the basketball legend Shaquille O’Neal, who is also a board member and franchisee of Papa John’s.
Financial Update
During the first half of fiscal 2020, Papa John’s generated $88 million in net operating cash flow and spent $14 million on its capital expenditures, allowing for $74 million in free cash flow. Those free cash flows fully covered $15 million in common dividend payments and $7 million in dividend payments to preferred stockholders during this period. Papa John’s did not spend a significant amount of money repurchasing its common stock during the first half of this fiscal year. During the pandemic, Papa John’s has continued to make good on its dividend obligations to common shareholders.
As of June 28, 2020, Papa John’s had $76 million in cash and cash equivalents on hand versus $24 million in short-term debt (includes $4 million in current finance lease liabilities) and $333 million in long-term debt (includes $5 million in long-term finance lease liabilities). Though we prefer companies with net cash positions, the net debt position of Papa John’s appears manageable given its strong free cash flows. Papa John’s is aided by its low capital expenditure requirements, meaning it does not need to spend significant amounts on capital expenditures to maintain its revenue generating abilities.
Concluding Thoughts
The near- and medium-term growth outlook for Papa John’s looks quite promising, supported by its ability to take market share, though that is already reflected in its stock price. We are not interested in adding shares of PZZA to our newsletter portfolios at this time given that shares are already trading near the top end of our fair value estimate range. Some businesses we are willing to “pay a premium” for given their enormous free cash flows, very promising long-term growth outlooks (supported by secular growth tailwinds) and pristine balance sheets, like Apple Inc (AAPL), but Papa John’s is not one of those companies. However, we appreciate Papa John’s asset-light business model and focus on franchise operations.
On a final note, back on March 17, 2020 (link here) we highlighted Domino's Pizza Inc (DPZ) as one of our ‘Top Ten Ideas for Consideration Amid COVID-19’ and shares of DPZ have surged since then. During Domino’s Pizza’s second quarter of fiscal 2020 (period ended June 14, 2020), its US same-store sales rose by 16.1% year-over-year. Past investments in its digital infrastructure played a key role in making that growth possible.
-----
Restaurants - Fast Food & Coffee/Snack: ARCO, DPZ, DNKN, JACK, MCD, PZZA, SBUX, WEN, YUM
Related: AAPL, UBER, GRUB, XLY, DIA, IYC, IECS, VCR
-----
Valuentum members have access to our 16-page stock reports, Valuentum Buying Index ratings, Dividend Cushion ratios, fair value estimates and ranges, dividend reports and more. Not a member? Subscribe today. The first 14 days are free.
Callum Turcan does not own shares in any of the securities mentioned above. Apple Inc (AAPL) is included in both Valuentum’s simulated Best Ideas Newsletter and Dividend Growth Newsletter portfolios. Some of the other companies written about in this article may be included in Valuentum's simulated newsletter portfolios. Contact Valuentum for more information about its editorial policies.
0 Comments Posted Leave a comment