Oil Markets Get Decimated
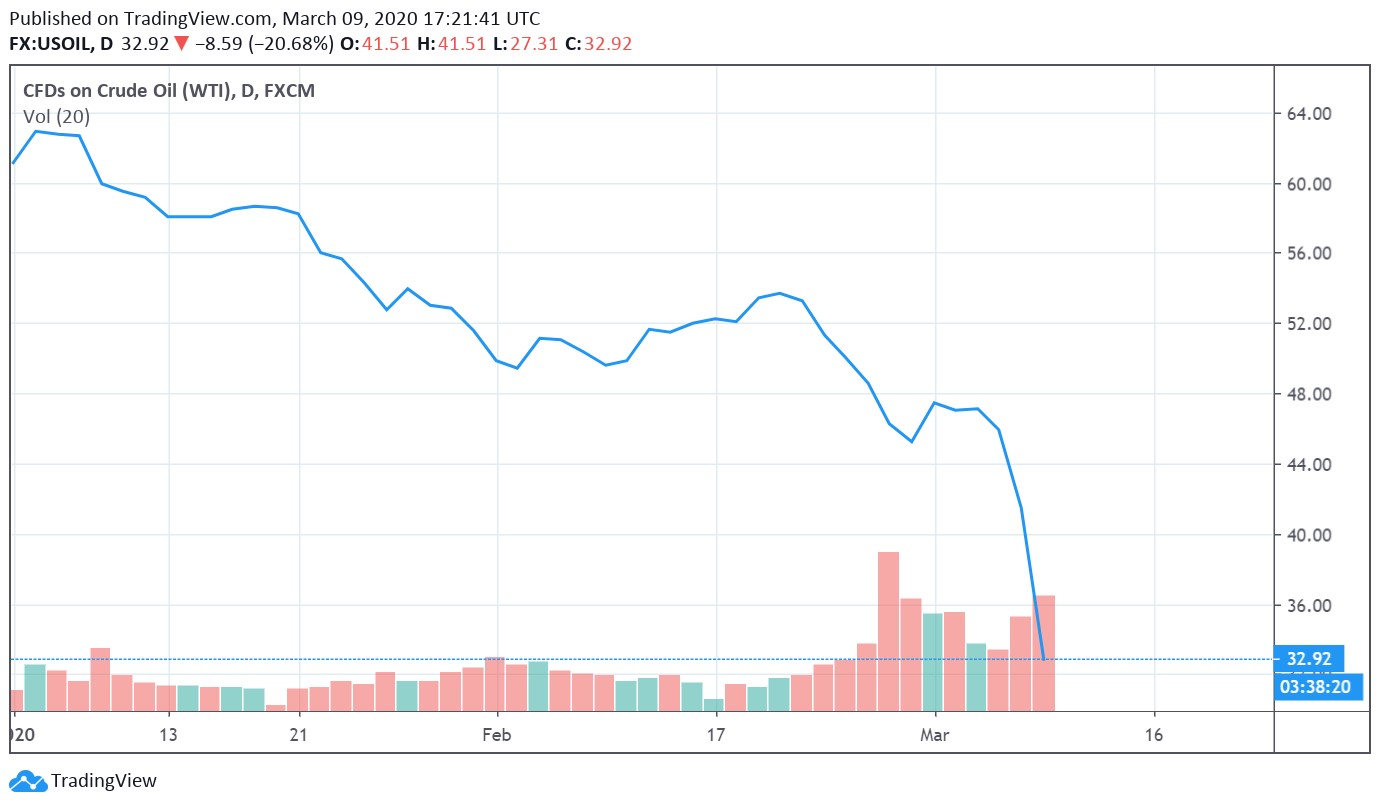
Image Shown: Oil prices have been decimated year-to-date.
By Callum Turcan
We are following up on our ‘Oil Prices Collapse, Reiterating 2,350-2,750 S&P 500 Target Range; Credit Crunch Looming?’ note (link here) published Sunday, March 8, to provide additional commentary on what’s going on in the shale patch right now. As of this writing, oil prices (BNO, USO) continue to get hammered. Here’s what we had to say in that recent note:
The independent upstream producer space (XOP) is careening off a cliff, and that was before the OPEC+ cartel was unable to reach an agreement during their joint meeting (OPEC and non-OPEC members) on March 6. Due to the inability for the oil cartel to reach a deal, largely because Russia (RSX) wouldn’t get onboard with additional Gulf state-backed supply curtailments, Saudi Arabia (KSA) instead decided to embark on a full on price war.
The massive oil exporter reduced what it known as its official selling price (‘OSP’) for April to key markets around the world, including those in Europe and Asia, effectively attempting to steal market share from Russia, the US, and other exporters. In addition to that, Saudi Arabia is also getting ready to ramp up its oil production levels, possibly adding 1+ million barrels per day to global supply over the coming months.
Brent tanked ~20% according to trading action as of late Sunday, March 8 [and traded down ~19% as of this writing on Monday, March 9], and the futures curve points towards realizations for the upstream space (firms that produce and sell raw energy resources) below $40 per barrel of oil for some time. Demand destruction from the ongoing novel coronavirus (‘COVID-19’) epidemic combined with a potentially prolonged oil price war could see Brent march below $30 per barrel in the near term [currently Brent deliveries for May 2020 are trading near $36-$37 per barrel as this writing on Monday, March 9].
Industry Response
On March 9, Diamondback Energy Inc (FANG) announced that it was going to transition from running nine completion crews to six in response to plummeting raw energy resources pricing. Please note that completion crews are the teams that stimulate wells via hydraulic fracturing (in this instance), so by scaling back these activities, Diamondback Energy is accepting that it needs to reduce its production (or at the very least, stop growing its production base). These changes are expected to be implemented by April, and one of those completion crews were already dropped as part of Diamondback Energy’s previous strategy. In addition to this, Diamondback Energy is reducing its rig count by two starting in April, with another rig count reduction (of one) expected in the second quarter of 2020.
This is a complete reversal from what Diamondback Energy had been planning earlier, as recently as February 2020. Here’s what the company’s CEO, Travis Stice, had to say during Diamondback Energy’s fourth quarter and full-year 2019 conference call in response to a question from an analyst (emphasis added):
“We did not slowdown in the second half of the year and we have no intention to this year. We're running 21 big rigs today, two salt water disposal rigs and you know 8.5 factors essentially and that pace should be pretty consistent.
I think we do plan to grow off of what was a very good number in Q4 and then as you think about the rest of the year, we should have fairly consistent growth from Q2 through Q4. So we would really like to set up here and also the set up for ‘21 as we don't plan on slowing down in the back half of the year.”
At the time this wasn’t a good call, in our view, given that raw energy resources were trading at very low price levels. The growth for the sake of growth mentality has gripped the shale patch for a very long time. Shares of FANG are trading down over 44% on Monday, March 9, as of this writing.
In 2019, Diamondback Energy generated negative free cash flows (capital expenditures are defined here as ‘drilling, completions and non-operated additions to oil and natural gas properties’ plus ‘infrastructure additions to oil and natural gas properties’ plus ‘additions to midstream assets’ keeping in mind line-items such as ‘acquisition of midstream assets’ indicate that Diamondback Energy’s ‘additions to midstream assets’ doesn’t include activities we would classify as M&A) as you can see in the graphic below.
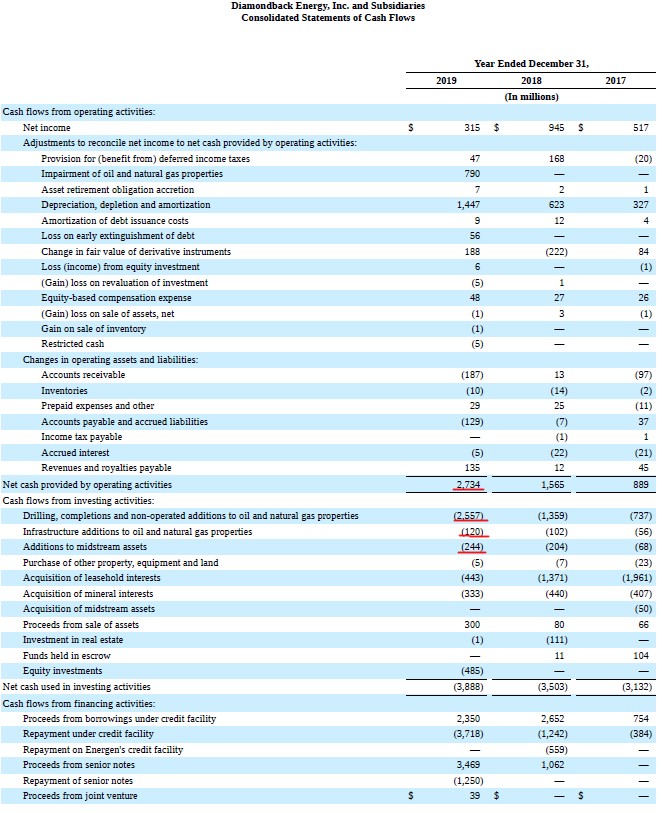
Image Shown: Diamondback Energy has historically outspent its net operating cash flows, seen through major investments in the line-items underlined in red that we would classify as capital expenditures. Image Source: Diamondback Energy – 2019 10-K Filing with additions from the author
Debt and equity issuances have been key as Diamondback Energy has covered this outspend by continuously tapping capital markets as you can see in the graphic up above (‘proceeds from borrowings under credit facility’ and ‘proceeds from senior notes’) and in the upcoming graphic down below. In the graphic below, we underlined Diamondback Energy’s equity issuances in red, and furthermore, the company’s weighted-average outstanding share count has grown from 97,688 million in 2017 to 163,843 million in 2019.
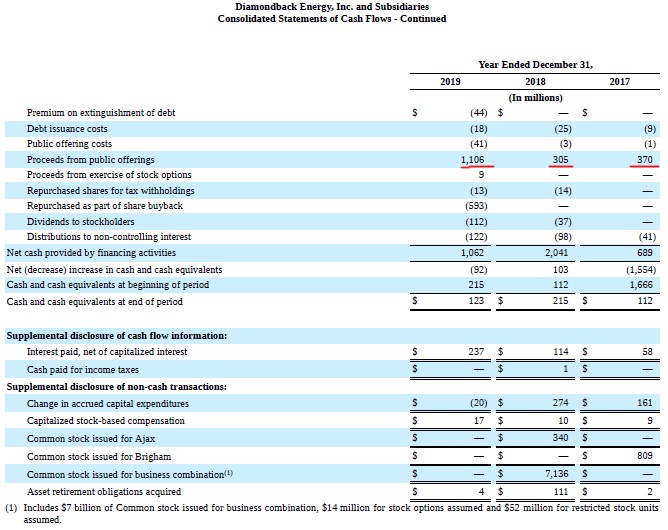
Image Shown: Diamondback Energy has used a combination of debt and equity issuances to cover its outspend over the past few years. Equity issuances have led to material shareholder dilution from 2017 to 2019, with that line-item underlined in red in the above graphic. Image Source: Diamondback Energy – 2019 10-K Filing with additions from the author
While some of this dilution was to cover Diamondback Energy’s acquisition activity, including its purchase of Energen Corporation in 2018, that doesn’t change the fact that while on an absolute basis Diamondback Energy has grown materially over the past several years, shareholders have been aggressively diluted to make that happen. Furthermore, the firm exited 2019 with a net debt load of over $5.2 billion and had relatively little cash on hand ($0.1 billion in cash and cash equivalents along with a negligible restricted cash position). With all this in mind, combined with the collapse in crude oil and other raw energy resources pricing, Diamondback Energy had no choice but to scale back its drilling and completion activity.
In our view, the firm is going to have to make additional cuts to its drilling and completion this year (and those will have to be some major cuts) if there isn’t a V-shaped recovery, which we very much doubt will be the case. Shares of Diamondback Energy currently yield ~5.5%, and in our view a payout cut is now quite likely in the near-term. A large net debt load and a lack of free cash flows means those dividend payments just aren’t sustainable.
Another company, Parsley Energy Inc (PE), also announced a reduction in its drilling and completion activity. Here’s what the firm had to say in its press release published on March 9 (emphasis added):
Consistent with the Company’s commitment to free cash flow generation and in response to recent commodity price trends, Parsley has begun to reduce development activity in 2020. During January and February, Parsley operated 15 development rigs and five frac spreads on average. On March 6, Parsley dropped to three frac spreads and has approved plans to drop to 12 rigs as soon as practicable. Parsley plans to further reduce its activity pace in the near-term.
The reduced completion activity (denoted as a reduction in its frac spreads) is what will curtail production growth or potentially see Parsley Energy’s output shift lower, and the reduced drilling activity will help prevent a large build up of drilled but uncompleted wells (known as ‘DUCs’). Shares of PE are trading down over 32% as of this writing on Monday, March 9. During the past three years (2017-2019), Parsley Energy has not been free cash flow positive as you can see in the upcoming graphic down below.
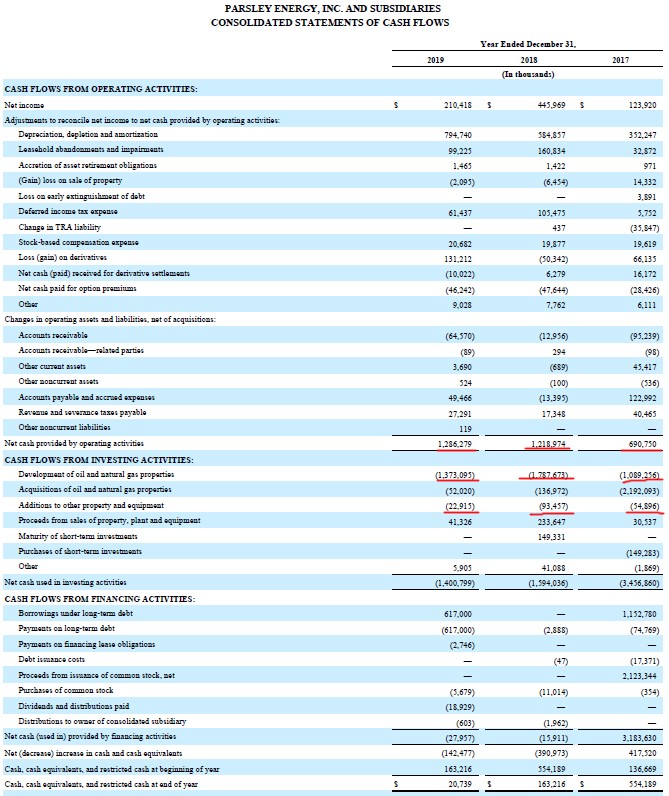
Image Shown: Parsley Energy’s capital expenditures are underlined in red, as is its net operating cash flows. As you can see, the company has not been free cash flow positive over the past three years (2017-2019) and as such, had to cut back on its drilling and completion activity in the face of materially lower raw energy resources pricing. Image Source: Parsley Energy – 2019 10-K Filing with additions from the author
At the end of 2019, Parsley Energy had a net debt load that stood at almost $2.2 billion. Given that large net debt load and its lack of free cash flows, Parsley Energy will likely cut its dividend in the near term, in our view. Shares of PE yield ~2.9% as of this writing.
Without free cash flows, the only choice Parsley Energy has is to attempt to refinance that burden or turn to equity markets to raise capital (a task made significantly harder given recent trading activity in upstream oil & gas names). This is partially why we see a credit crunch as increasingly likely, as it could very well start in the shale patch but the second-order effects (the negative impact large bad debt expenses will have on the banking system in the US and elsewhere) could trigger problems across the board as lending conditions tighten up.
Concluding Thoughts
The outlook for independent upstream names has become dire. In an industry that’s generated little to no free cash flow since 2010, and instead has relied heavily on capital markets to stay afloat; for all the hype surrounding surging US production of raw energy resources there hasn’t been much shareholder value creation to show for it. Consumers and certain US states have been big winners, sure, but equity holders and now potentially credit holders have largely taken it on the chin. We will continue following the space for our members going forward, and please note there’s a very good reason we removed the Energy Select Sector SPDR ETF (XLE) from our newsletter portfolios back in August 2019 (link here); the outlook for the energy space (particularly oil & gas) was lackluster at the time and has since become dire.
Please note we’ve since shifted to a material cash "position" in both the Best Ideas Newsletter portfolio and Dividend Growth Newsletter portfolio, and furthermore, we re-initiated our market “crash” protection in both newsletter portfolios early-Friday, March 6 (link here covering those changes). Beginning April 2020, as a separate feature to our website, we'll be starting to release via email options-related ideas (two per month) and commentary, as well as educational information, to those that have subscribed to this feature. We will denote options commentary with the word 'OPTIONS' at the start of any email title for those adding this feature.
If you are interested in learning more about options, please consider our new service here.
Please be sure to ask your financial advisor if options may be right for you. Derivatives trading is risky, can result in complete loss of premium (capital), and most options expire worthless.
Oil & Gas (Majors Industry) – BP CVX COP XOM RDS.A RDS.B TOT
Independent Oil & Gas Industry – APA COG CLR DVN EOG MRO OXY PXD
Industrial Minerals - ARLP, CCJ, CNX, HCR, NRP
Refining Industry – HES HFC MPC PSX VLO
Oil & Gas Pipeline Industry – ENB ET EPD KMI MMP
Related: EWO, SPY, KSA, FM, ERUS, FXI, KWEB, EWI, EWQ, EWG, EWU, EWJ, EWY, MCHI, CEO, USO, BNO, ARMCO, RSX, XLE, XOP, VDE, AMLP, AMZA
-----
Valuentum members have access to our 16-page stock reports, Valuentum Buying Index ratings, Dividend Cushion ratios, fair value estimates and ranges, dividend reports and more. Not a member? Subscribe today. The first 14 days are free.
Callum Turcan does not own shares in any of the securities mentioned above. SPY put options with a June 30, 2020 expiration date and a $250 strike price are included in both Valuentum’s simulated Best Ideas Newsletter and Dividend Growth Newsletter portfolios. Kinder Morgan Inc (KMI) is included in Valuentum’s simulated Dividend Growth Newsletter portfolio. BP plc (BP), Enterprise Products Partners L.P. (EPD), and Magellan Midstream Partners L.P. (MMP) are all included in Valuentum’s simulated High Yield Dividend Newsletter portfolio. Some of the other companies written about in this article may be included in Valuentum's simulated newsletter portfolios. Contact Valuentum for more information about its editorial policies.
0 Comments Posted Leave a comment