Buffett Makes Another “Unforced Error” in Airlines

Image Source: Value Trap: Theory of Universal Valuation
By Callum Turcan
The commercial passenger airline industry is nearly impossible, to downright impossible, to generate meaningful shareholder value in. Specifically as it relates to the US, since the Airline Deregulation Act of 1978 (which among other things allowed airlines to set their own routes without always needing to seek regulatory approval which in turn greatly increased competition, lowered fares, and saw a boom in travelers and miles traveled) various airlines have gone under (such as Pan Am in 1991 and Delta Air Lines (DAL) in 2005 along with others) as competitive advantages once created by government barriers no longer existed. This is true globally as well, as rising competition from private foreign and sovereign-owned airlines fundamentally altered the industry’s landscape.
Setting the Stage
Rising jet fuel costs, largely a function of rising crude oil prices, are a factor here. Hefty labor expenses and the occasional strike combined with large fixed costs makes managing these behemoths no easy task. Then there’s the problems that arise when the airlines are forced to ground large parts of their fleets, which was clearly highlighted via the ongoing situation regarding Boeing’s (BA) 737 MAX plane (several tragedies forced the plane to stay grounded globally for some time now and airlines remain wary of restarting operations as Boeing works on a fix). Furthermore, during times of lackluster travel demand, high fixed costs and the lack of consistent earnings often decimate cash flow profiles and inevitably balance sheets.
Here an excerpt from our book Value Trap setting the stage for what we are getting at here:
“Buffett said once that he had an 800 number that he would call anytime that he wanted to buy an airline stock again. Maybe that number has been disconnected after all these years, as Berkshire Hathaway (BRK.A) (BRK.B) is once again an owner of airline equities. Though the structural characteristics of an industry can and do change over time, I’m very skeptical the airline business has changed permanently for the better. Today’s airline business may be more oligopolistic in nature and much more profitable thanks to consolidation and the right-sizing of capacity, but it retains a notoriously cyclical passenger-demand profile, ties to the level and volatility of energy resource prices, considerable operating leverage, all the while barriers to entry remain low, exit barriers remain high, and fare pressure endures. The next downturn may not see as many bankruptcies as prior economic cycles due to lower unit-cost profiles, but it may turn out to only be modestly “less bad” for equity holders." – Value Trap, published December 2018
As an aside, Berkshire Hathaway continued to own a material equity stake in Southwest Airlines (LUV), Delta Air Lines, and United Airlines (UAL) at the end of 2019; however, that doesn’t change our thesis as it relates to shares of BRK.B being a top holding in our Best Ideas Newsletter portfolio given that those stakes combined are equal to ~1% of Berkshire Hathaway’s market capitalization as of this writing (using the number of shares owned at the end of 2019 and considering where those airlines were trading at on March 5). To read more about why we like Berkshire Hathaway as a high quality defensive play during these turbulent times, please check out this article here.
Airlines Just Can’t Catch a Break
Pivoting back to the airlines now. To be fair, there are occasionally good times in the space, but any profits generated during such times are ephemeral in nature. We wanted to draw attention to this dynamic as airline stocks are once again coming under fire, this time from the negative impacts on travel demand due to the ongoing novel coronavirus (‘COVID-19’) epidemic. Global travel demand has been decimated of late and airlines are preparing for the worst. United Airlines has frozen its hiring activities, salary increases, and is decreasing the number of flights both domestically and internationally through a strategy outlined on March 4. Southwest Airlines released an investor update on March 5 which noted:
…in recent days, the Company has experienced a significant decline in Customer demand, as well as an increase in trip cancellations, which is assumed to be attributable to concerns relating to reported cases of COVID-19. Based on these recent revenue trends, which are currently expected to impact the remainder of March 2020, the Company now estimates its first quarter 2020 operating revenues to be negatively impacted in the range of $200 million to $300 million, and RASM [revenue per available seat mile, an industry-specific metric] to be in the range of down 2 percent to up 1 percent, year-over-year, as compared with its previous guidance of a year-over-year increase in the range of 3.5 to 5.5 percent.
Delta Air Lines plans on presenting at an investor conference on March 10, and the firm may opt to provide some concrete details on how management expects the firm’s financial and operational performance with fare during the ongoing COVID-19 epidemic. As revenues are expected to shrink materially across the industry, costs per available seat mile are forecasted to start rising significantly due in large part to hefty fixed costs. On a year-over-year basis, the severe winter conditions experienced in parts of the US in 2019 offer some relief (as winter in the US was less severe this year); however, Southwest Airlines still expects its operating costs per available seat mile to rise by 5-7% in the first quarter of 2020 on a year-over-year basis (due largely to the grounding of the 34 planes within its MAX fleet). Please note that guidance does not include fuel, oil and profit sharing expense considerations.
In the upcoming graphic down below please note the hefty underperformance of the U.S. Global Jets ETF (JETS), which owns a basket of commercial passenger airline stocks, relative to the S&P 500 Index (SPY) over the past year.
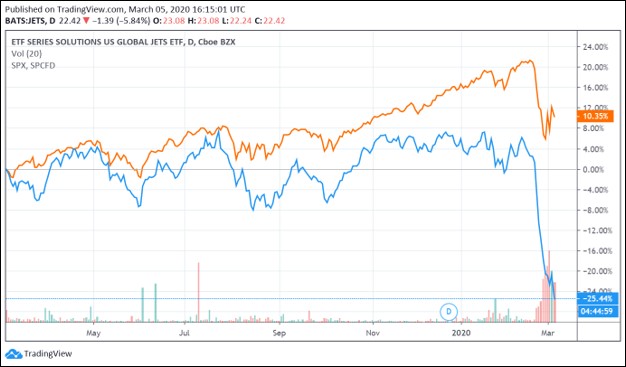
Image Shown: Airlines have had a rough time over the past year, but this is nothing new historically speaking.
Additionally, please note in the upcoming graphic down below how the three aforementioned airlines (DAL, LUV, UAL) significantly underperformed against the S&P 500 index over the past year.
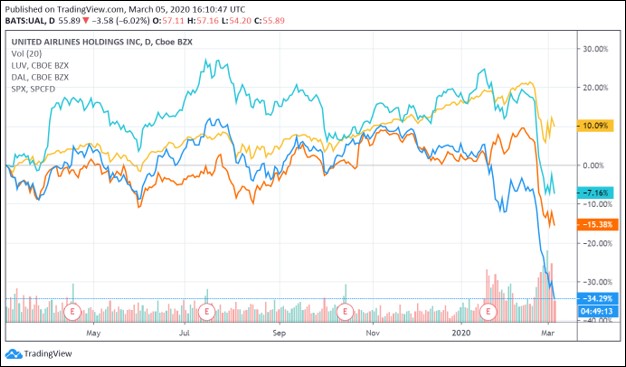
Image Shown: The S&P 500 index is shown by the yellow line, Delta Air Lines is shown by the cyan line, Southwest Airlines is shown by the orange line, and United Airlines is shown by the blue line as it relates to the performance of this index and these equities over the past year. Clearly, airlines have had a rough time of late, but again this is nothing new.
Here’s how we view the airline industry:
The airline industry has undergone meaningful changes since the beginning of the last decade. The painful restructuring by most of the legacy carriers via Chapter 11, significant consolidation by the majors, the introduction of ancillary revenue streams, and the ongoing efforts to rightsize capacity to slow weakening real yields are but a few. Though unarguably these are steps in the right direction, airlines remain shackled to the very poor structural characteristics of their industry, which has sent more to bankruptcy than any other in our coverage. Airline stocks should be viewed as merely speculative bets.
Concluding Thoughts
The commercial passenger airline industry at-large, due to its lack of competitive advantages, is a classic example of a value trap (i.e. low P/Es or traditional multiples generally don't mean shares are cheap). When times get tough the space is often gripped by bankruptcies and when times are good, those profits are short-lived. We covered this concept extensively in our book Value Trap, which can be ordered from here, and we strongly suggest our members consider taking advantage of the investment framework laid out in the book.
-----
Expect More Market Volatility Ahead
The book Value Trap: Theory of Universal Valuation is much more than a theory that ties together quantitative multi-factor models to the expected return function of enterprise valuation, showing that risk factors must be forward-looking in nature (a huge shift in quantitative thinking). The book is much more than a documented thesis in the value-timing dynamics of overlaying technical/momentum indicators with tried-and-true enterprise valuation. In showing how all valuation multiples are but shortcuts and ambiguous, as in the failures of the traditional quant B/M value factor, the text is more than a warning about the demise of traditional quant value analysis, which is off to one of its worst start in 2020 in decades.
The book Value Trap is more than a telling of the story of a team of analysts that identified a mispricing across a major sector, went against the crowd with their unpopular views, and despite all odds, was proven correct in time. On a price basis, from mid-June 2015 through March 2, the S&P 500 (SPY) has advanced 46%, while the Alerian MLP ETF (AMLP) has declined nearly 58%, a huge source of alpha. According to data from CBRE Clarion through September 2019, there have now been 111 distribution/dividend cuts. Many more have occurred since then, too.
Value Trap offers much more than this. It also warns about the current market structure, and how the markets have become in some ways, a risky place for even the most risk-tolerant retirees to park their hard-earned savings. Volatility has always been part of the stock market, but swings of the magnitude of last week and on Monday, March 2, are simply not “normal.” Quite simply, if we have to point to the Great Depression and Black Monday of 1987 as analogs for what is becoming normal trading activity these days, we’re stretching to rationalize current market behavior, like a frog in boiling water.
Read Value Trap.
-----
Prime Aerospace & Defense Industry – BA FLIR GD LMT NOC RTN
Related: JETS, UAL, LUV, DAL, BRK.A, BRK.B
Tickerized for holdings in the JETS ETF.
----
Valuentum members have access to our 16-page stock reports, Valuentum Buying Index ratings, Dividend Cushion ratios, fair value estimates and ranges, dividend reports and more. Not a member? Subscribe today. The first 14 days are free.
Callum Turcan does not own shares of any of the securities mentioned above. Berkshire Hathaway Inc (BRK.A) (BRK.B) Class B shares are included in Valuentum’s simulated Best Ideas Newsletter portfolio. Some of the other companies written about in this article may be included in Valuentum's simulated newsletter portfolios. Contact Valuentum for more information about its editorial policies.
0 Comments Posted Leave a comment