Bank Earnings Solid During Second Quarter 2021
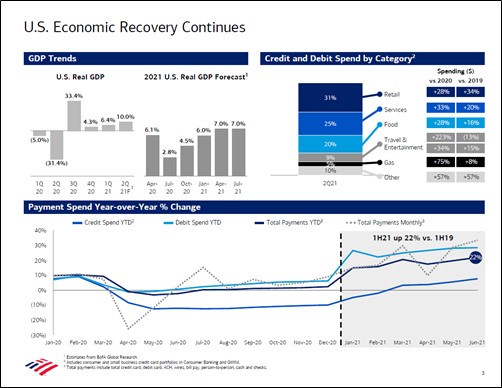
Image Source: Bank of America Corporation – Second Quarter of 2021 IR Earnings Presentation
In Alphabetical Order by Ticker: BAC, MS, JPM
By Callum Turcan
In this note, we cover three recent reports from the banking industry as earnings season gets underway. Ongoing coronavirus (‘COVID-19’) vaccine distribution efforts are enabling the domestic economy to reopen in earnest, and consumers are beginning to return to “pre-pandemic activities,” though the risk of variants remains. In our view, the outlook for the US economy is quite bright. The outlook for net interest margins (‘NIMs’) should improve alongside the domestic economy, though yields remain rather low as of this writing and lackluster NIMs weighed on the performance of the banking space at-large last quarter.
Bank of America (BAC)
On July 14, Bank of America Corporation (BAC) reported second quarter 2021 earnings that missed consensus top-line estimates but beat consensus bottom-line estimates. The firm’s bottom-line benefited from a large net-credit-loss reserve release after it set aside billions last year to cover potential loan losses during the initial phases of the COVID-19 pandemic. Deposits were up 14% year-over-year company-wide and Bank of America had a Common Tier 1 standardized equity ratio of 11.5% in the second quarter of 2021 (the minimum requirement is a ratio of 9.5% according to the firm).
Bank of America launched a $25 billion share buyback program in April 2021 and repurchased $4.2 billion of its stock last quarter. In June 2021, the firm announced it would boost its quarterly dividend 17% effective in the third quarter after a successful Fed stress test. The company’s efficiency ratio (non-interest expenses divided by revenues) stood at 70% in the second quarter of 2021, up sharply from year-ago levels though this is partially due to the firm contributing $0.5 billion to the Bank of America foundation and partially due to the $0.3 billion in increased expenses associated with unemployment claims last quarter.
Its digital strategy continues to play out favorably, with 40.5 million active digital banking users last quarter at its Consumer Banking unit, up 3% year-over-year. Bank of America’s net charge-off ratio fell to 0.27% in the second quarter of 2021 from 0.45% in the same period a year ago. Here is what management had to say regarding Bank of America’s net charge off situation during the firm’s latest earnings call (emphasis added):
“Net charge-off this quarter fell to $595 million or 27 basis points of average loans. This is the lowest loss rate in more than two decades. That is 28% lower than Q1 and more than 30% below the Second Quarter of 2019.” --- Paul Donofrio, Bank of America’s CFO
Bank of America noted in its earnings presentation that “credit card delinquencies remain below pre-pandemic levels as deferrals expired and balances declined” which is a promising sign.
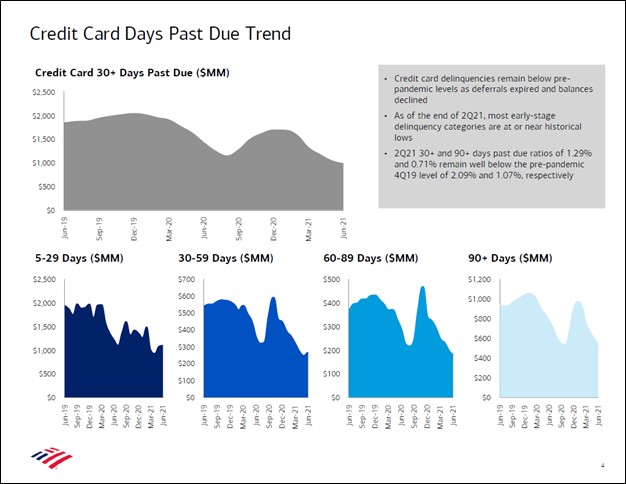
Image Shown: Bank of America’s credit card delinquency rates have been aggressively trending in the right direction of late. Image Source: Bank of America Corporation – Second Quarter of 2021 IR Earnings Presentation
The company’s return on average tangible common shareholders' equity stood at 19.9% in the second quarter versus 7.6% in the same quarter the prior year. Bank of America is a rock-solid enterprise and remains one of our favorite banks out there.
Morgan Stanley (MS)
On July 15, Morgan Stanley (MS) reported second-quarter 2021 earnings that beat both consensus top- and bottom-line estimates, aided by a sharp reduction in its provision for credit losses as the economy continues to improve. Strength at its ‘Wealth Management’ and ‘Investment Management’ businesses was also key to its strong financial performance. The firm recently doubled its quarterly dividend and boosted its share repurchase program up to $12 billion over the next year after a successful Fed stress test.
Morgan Stanley recently acquired E*TRADE Financial through an all-stock deal worth ~$13 billion and Eaton Vance through a cash-and-stock deal worth ~$7 billion. When removing integration-related expenses, Morgan Stanley generated a return on tangible common equity (‘ROTCE’) of 19.0% in the second quarter (up from 17.8% in the same period the prior year). The firm had an efficiency ratio of 68% (flat year-over-year) and its Common Tier 1 standardized capital ratio stood at 16.7% in the second quarter of 2021.
James Gorman, CEO of Morgan Stanley, noted during the company’s latest earnings call that “given our current earnings momentum, it takes some time to fully distribute that capital, but we feel strongly that this year is the time to make a big start.” Things are looking up for Morgan Stanley and the market is clearly taking notice given the impressive technical performance seen at shares of MS year-to-date.
JPMorgan (JPM)
On July 13, JPMorgan Chase & Co (JPM) reported second-quarter 2021 earnings that beat both consensus top- and bottom-line estimates, with a large net credit reserve release providing a powerful uplift to its earnings. Excluding the net credit reserve release, JPMorgan reported a ROTCE of 18% last quarter (its ROTCE stood at 23% when including the reserve release), up sharply from the 9% it reported in the same period last year. Its Common Tier 1 standardized capital ratio stood at 13%, its outstanding loans were broadly flat year-over-year, and its deposits were up 23% year-over-year last quarter.
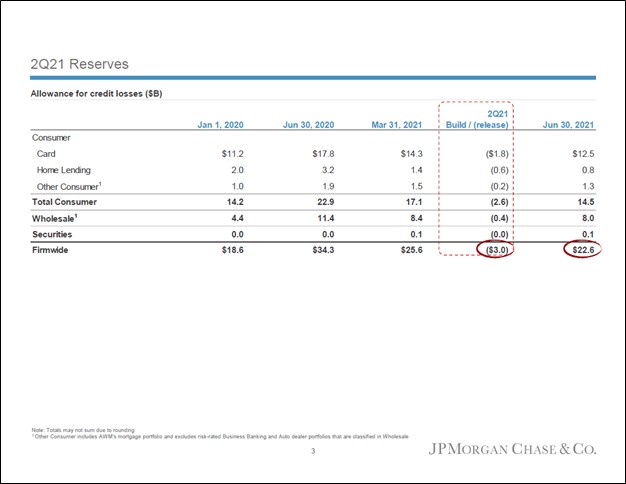
Image Shown: The improving outlook for the US economy played a leading role in enabling JPMorgan to reverse the huge build up in its loan loss reserves that occurred last year in the wake of the initial stages of the COVID-19 pandemic. Image Source: JPMorgan – Second Quarter of 2021 IR Earnings Presentation
The company’s adjusted overhead ratio (similar to adjusted efficiency ratio) stood at 56% last quarter, up from 50% in the second quarter of 2020, though flat sequentially. During JPMorgan’s latest earnings call, management stated that the firm had recently raised its full-year expense guidance and noted that volume and revenue-related expenses, along with a fierce market for banking talent, were key drivers behind the expense guidance increase. Its ‘Asset & Wealth Management’ unit more than doubled its net income last quarter on a year-over-year basis.
Jamie Dimon, JPMorgan’s CEO, stated that “we're going to be competitive in comp no matter what it takes” and JPMorgan’s CFO, Jeremy Barnum, followed up to that statement by noting “it’s also transaction-related volumes. It's also marketing expense in certain pockets. So, it's all the stuff that fits in the category of volume and revenue-related.” The company intends to continue investing in the business to remain competitive as pockets of the global economy begin to emerge from the COVID-19 pandemic, creating ample opportunities for JPMorgan to capitalize on.
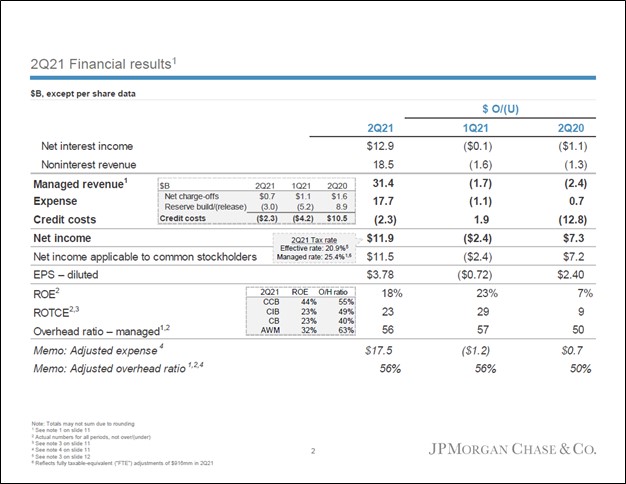
Image Shown: An overview of JPMorgan’s recent financial performance. Image Source: JPMorgan – Second Quarter of 2021 IR Earnings Presentation
Pivoting now, here is what JPMorgan’s management team had to say on the net charge-offs and reserve release situation during the firm’s latest earnings call (emphasis added):
“And then on credit costs, going back to last year again, you will recall, in last year's second quarter, we built $8.9 billion in credit reserves during the height of the pandemic, whereas this year, we released $3 billion. So in this quarter, credit costs were a net benefit of $2.3 billion. And setting aside the reserve release, it's also worth noting that net charge-offs of just over $700 million were half of last year's second quarter number and continue to trend near historical lows.” --- CFO of JPMorgan
JPMorgan also had a successful Fed stress test and recently boosted its quarterly dividend 11% sequentially, bringing it up to $1.00 per share starting in the third quarter. The firm spent $5.9 billion buying back its common stock last quarter and continues to focus on distributing cash back to shareholders in light of the improving macro backdrop. JPMorgan is one of the strongest banking institutions out there, and we are fans of the name.
Concluding Thoughts
After reviewing the second quarter earnings reports of several major US banking institutions, the domestic economy continues to stage an impressive though uneven economic recovery. Net credit write-offs have been trending aggressively lower of late, a welcome sign. Banks are taking advantage of their improving financial outlook and have been aggressively rewarding shareholders via dividend increases and/or large share buyback programs.
We include Financial Select Sector SPDR Fund (XLF) as an idea in the Best Ideas Newsletter portfolio to gain some exposure to this upside. Bank of America, Morgan Stanley, and JPMorgan represent three of the top ten largest holdings in the XLF ETF as of July 15. The largest holding in the XLF ETF as of July 15 was Berkshire Hathaway Inc (BRK.A) (BRK.B) Class B shares (ticker BRK.B), and we also include Berkshire Hathaway Class B shares as an idea in the Best Ideas Newsletter portfolio.
-----
Related: BRK.A, BRK.B, KBE, KRE, XLF, VFH, IYG, KBWB
Valuentum members have access to our 16-page stock reports, Valuentum Buying Index ratings, Dividend Cushion ratios, fair value estimates and ranges, dividend reports and more. Not a member? Subscribe today. The first 14 days are free.
Callum Turcan does not own shares in any of the securities mentioned above. Berkshire Hathaway Inc Class B shares (BRK.B) and Financial Select Sector SPDR Fund ETF (XLF) are both included in Valuentum’s simulated Best Ideas Newsletter portfolio. Some of the other companies written about in this article may be included in Valuentum's simulated newsletter portfolios. Contact Valuentum for more information about its editorial policies.
0 Comments Posted Leave a comment