Bank of America is Working Through a Difficult Time
When putting all the puzzle pieces together, we see Bank of America facing the headwinds of low rates and sizable credit provisioning with relative ease thanks to its substantial pre-tax, pre-provision earnings power. As long as the economy doesn’t get drastically worse from here, long term investors will benefit from normalized valuations on more normalized earnings in the not-too-distant future.
By Matthew Warren
Bank of America (BAC) posted difficult second quarter results July 16, though it beat analyst consensus estimates on both the top and the bottom lines. As you can see in the upcoming graphic down below, total revenue was down 3% compared to last year while net income was down 52% thanks to substantial provisioning for future credit losses.
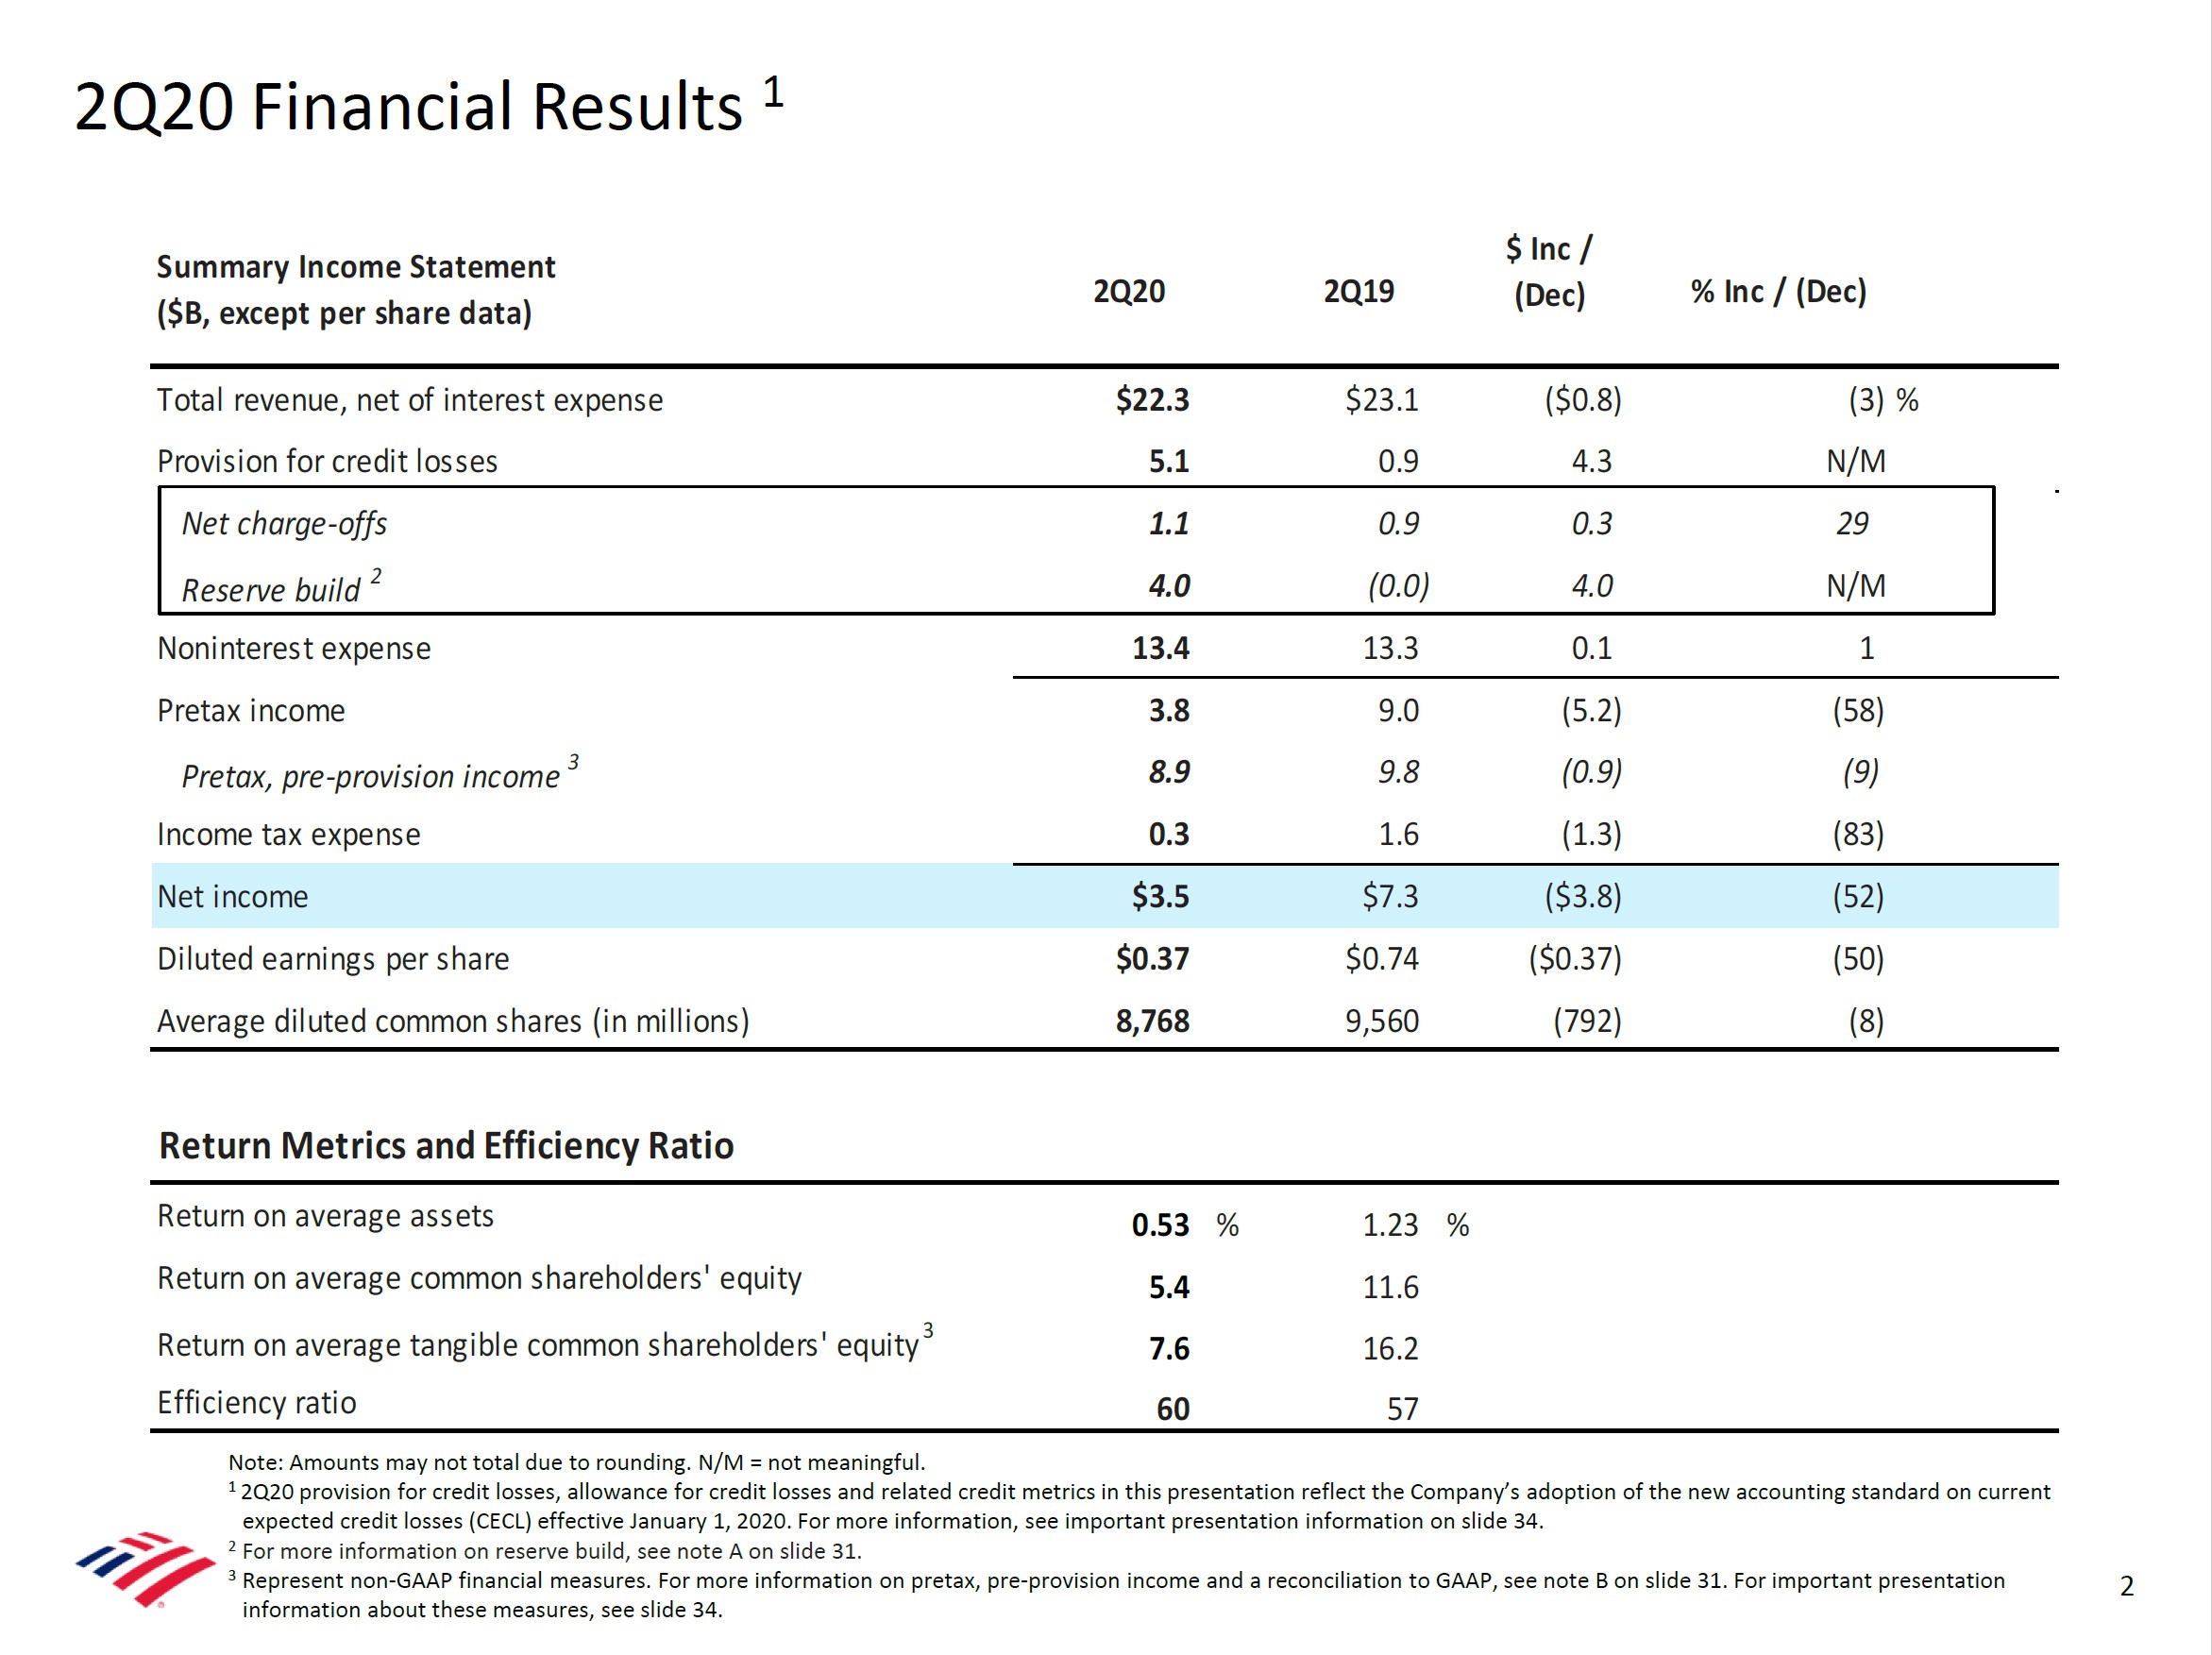
Image Shown: Summary of Bank of America’s 2Q2020 results. Image Source: Bank of America 2Q2020 Earnings Presentation.
Of note, the bank’s return on tangible common shareholders’ equity in the quarter of 7.6% was only a bit behind industry bellwether JPMorgan’s 9% in the same quarter. We think this is a near-term marker that Bank of America continues to close the gap with the industry’s best large bank.
Moving onto the breakdown of segment metrics in the upcoming graphic down below, one can see that the crown jewel of consumer banking is currently under substantial pressure due to outsized provisioning--especially in the credit card space. One can also see that, much like at industry peers, global markets business performance was a standout performer as volatile markets led to substantial trading revenues, especially in FICC (Fixed income, currencies, and commodities). Investment banking was also quite strong in the quarter, as clients bulked up their liquidity positions to withstand the Covid-19 pandemic.
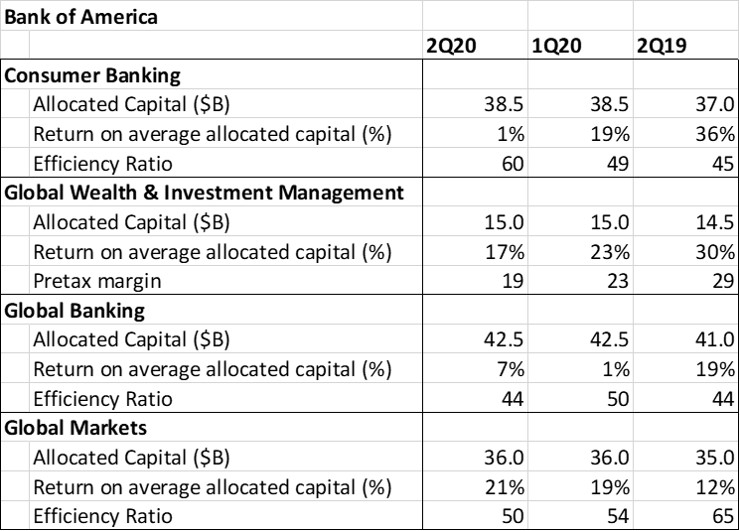
Image Shown: Bank of America’s segment metrics. Image Source Analyst collection of figures from Bank of America’s 2Q2020 Earnings Presentation.
We include the next graphic down below simply to highlight how provisions for credit losses are running well ahead of current charge offs. This is a trend that we are seeing across the industry. Bank income statements are notoriously pro-cyclical, meaning that they amplify both the good and the bad times thanks to the existing accounting rules.
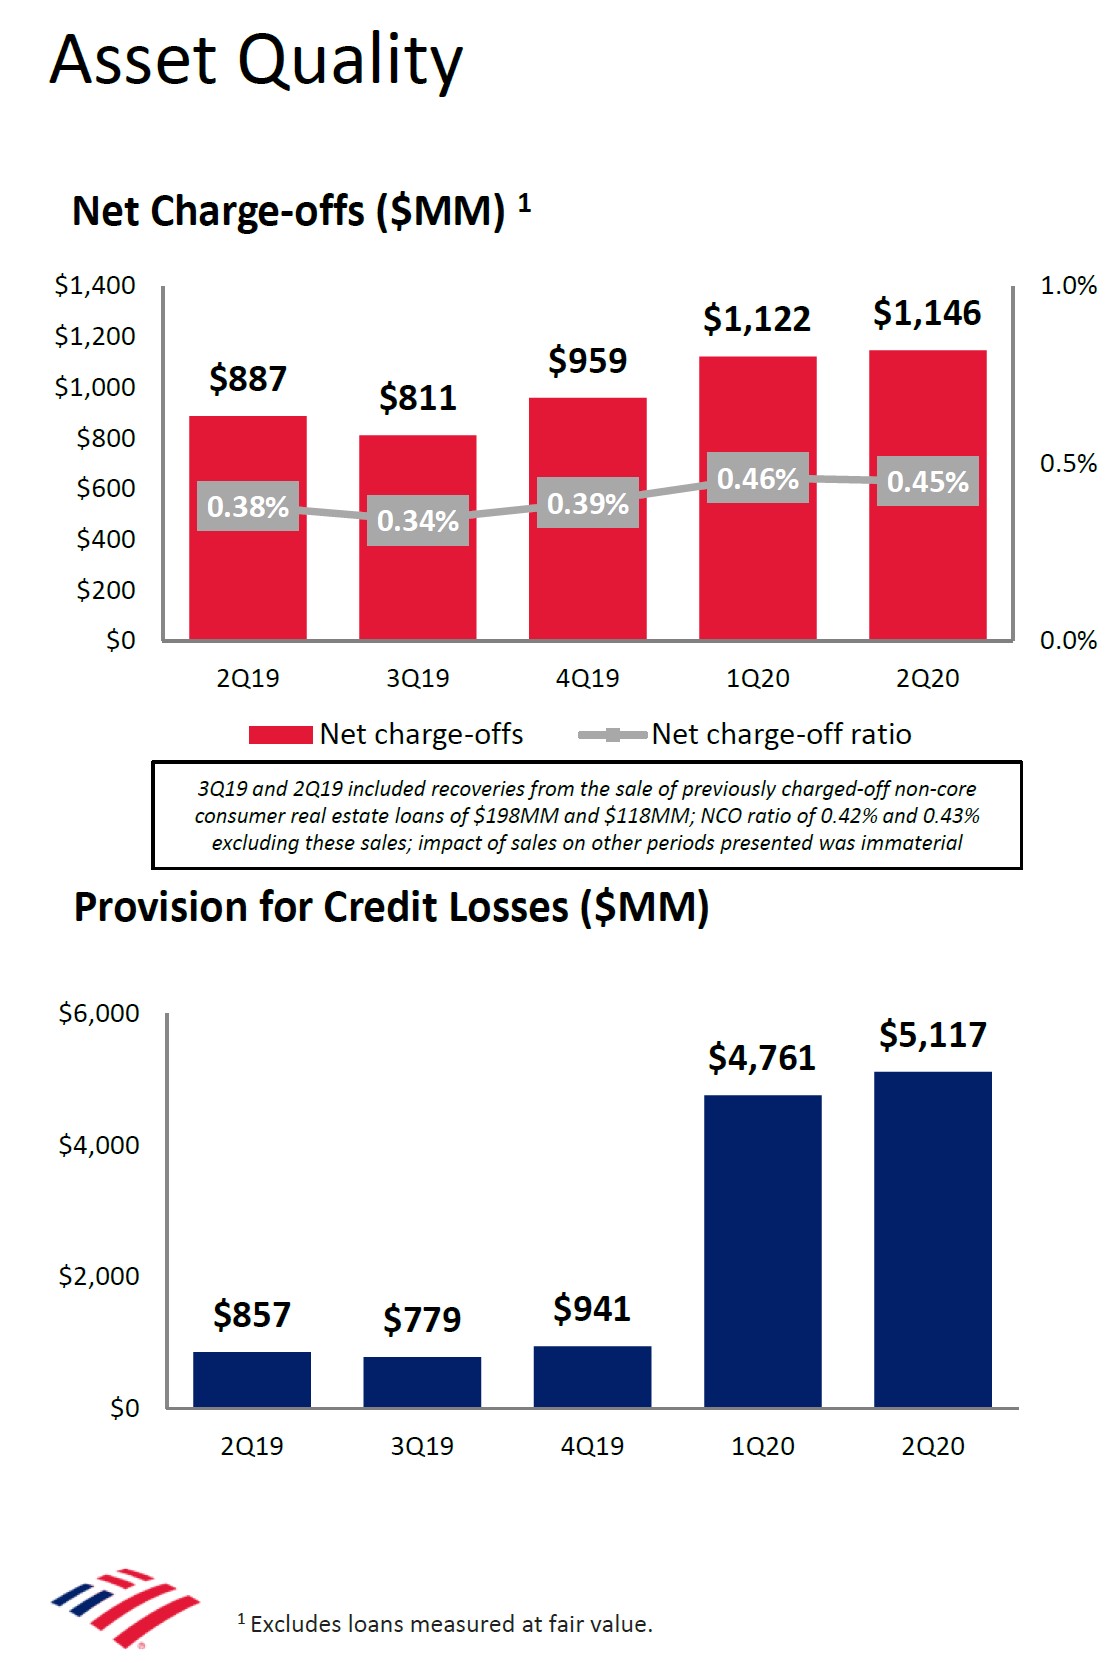
Image Shown: High levels of provisions are being put in place ahead of expected net charge-offs coming down the road. Image Source: Bank of America 2Q2020 Earnings Presentation
As you can see in the following quote from Bank of America CFO Paul Donofrio, company management is adamant that they have employed strict underwriting over the past decade since the Great Financial Crisis. Time will tell as this economic downturn (caused by the Covid-19 health crisis) proceeds to completion:
Our net charge-off ratio under this year's stress test was once again the lowest of our peers and has been the lowest in seven of the last eight years. Total net charge-offs this quarter were $1.1 billion or 45 basis points of average loans. Net charge-offs rose $24 million from Q1 with an uptick in commercial losses mostly offset by lower consumer losses.
Provision expense was $5.1 billion. Our reserve build of $4 billion reflects a weaker economic outlook since the end of Q1, which impacted expected future losses. While we saw increases in commercial reservable criticized exposures, impacted by the virus, overall credit thus far has been better than expected as NPLs only rose modestly versus our expectations.
Aside from credit costs, Bank of America is also facing some near-term pressure on its efficiency ratio (see upcoming graphic down below) due to the revenue pressure that largely stems from low interest rates direct negative impact on net interest income. As company management has done a great job controlling costs during the past several years, we expect efficiency ratios to improve once again on the other side of this pandemic.
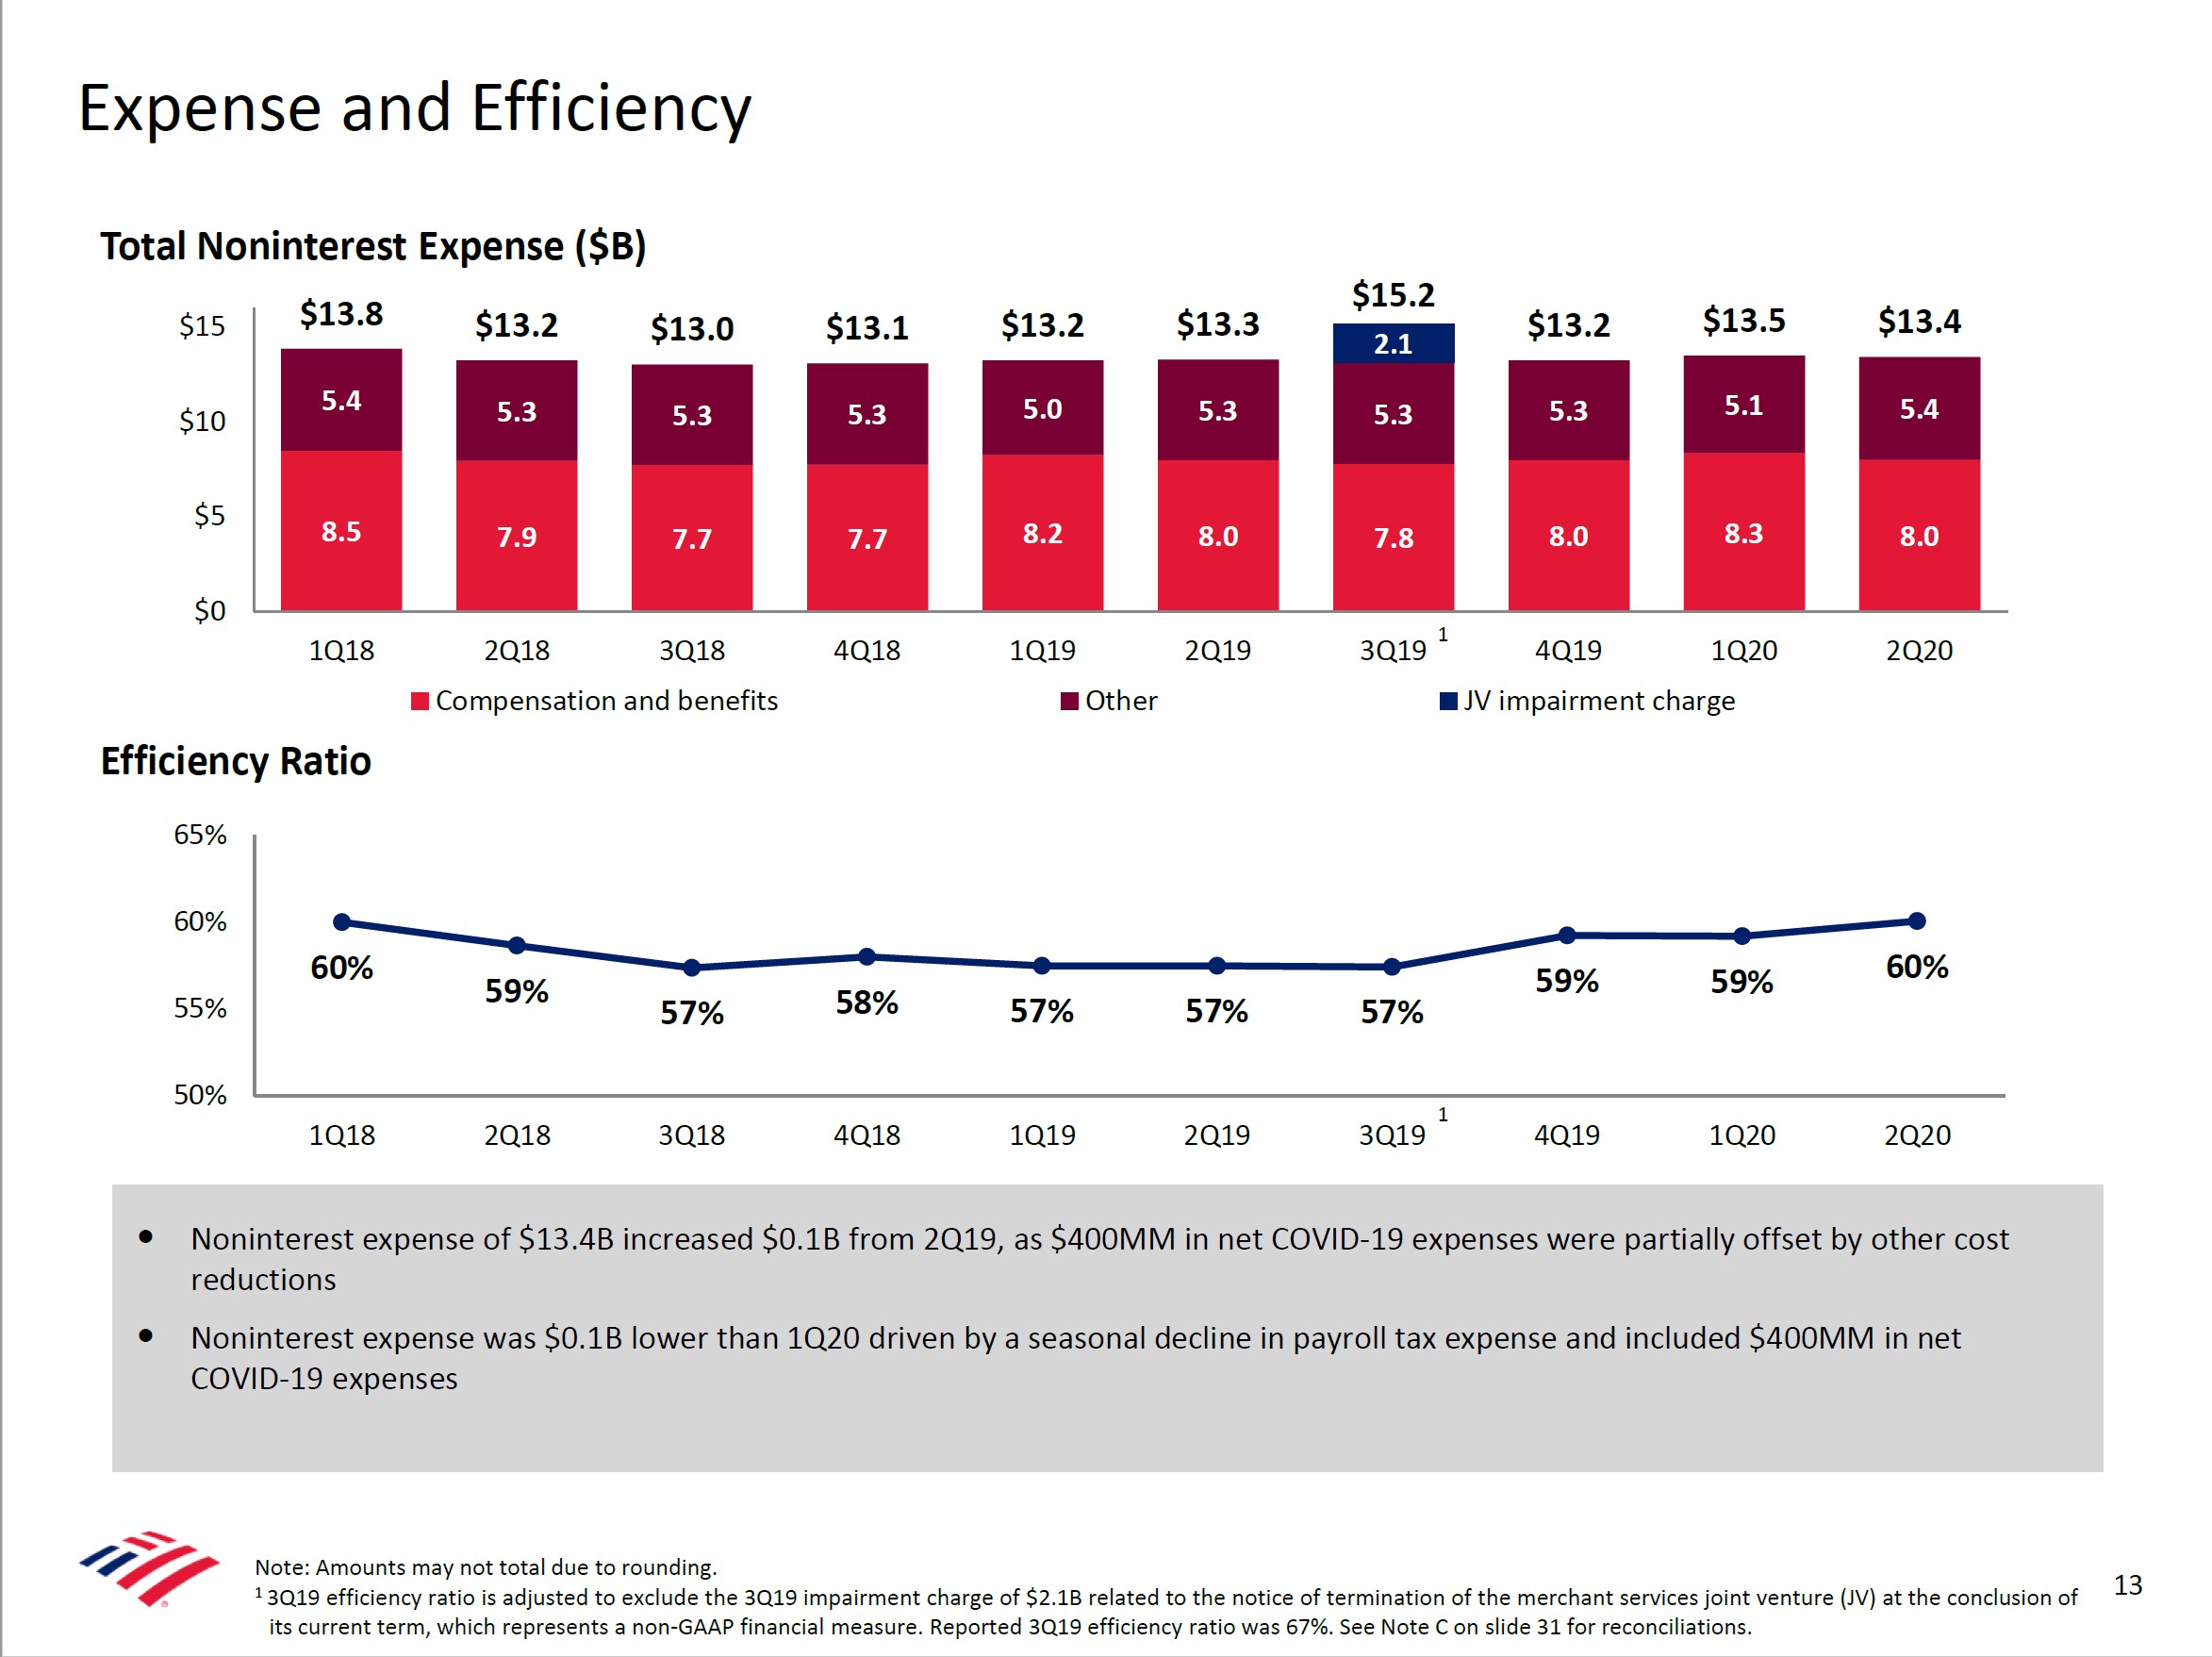
Image Shown: Decent cost control combined with revenue pressures have unfortunately meant slightly higher efficiency ratios. Image Source: Bank of America 2Q2020 Earnings Presentation.
Aside from the intelligence gained regarding Bank of America itself, one can also garner some insight into the broader macro economy from the upcoming graphic down below. Since Bank of America customers represent approximately $3 Trillion of annual spending, the below trends should be given some weight. As you can see, total spending is nearly at year ago levels in June, having been way down year over year back in April.
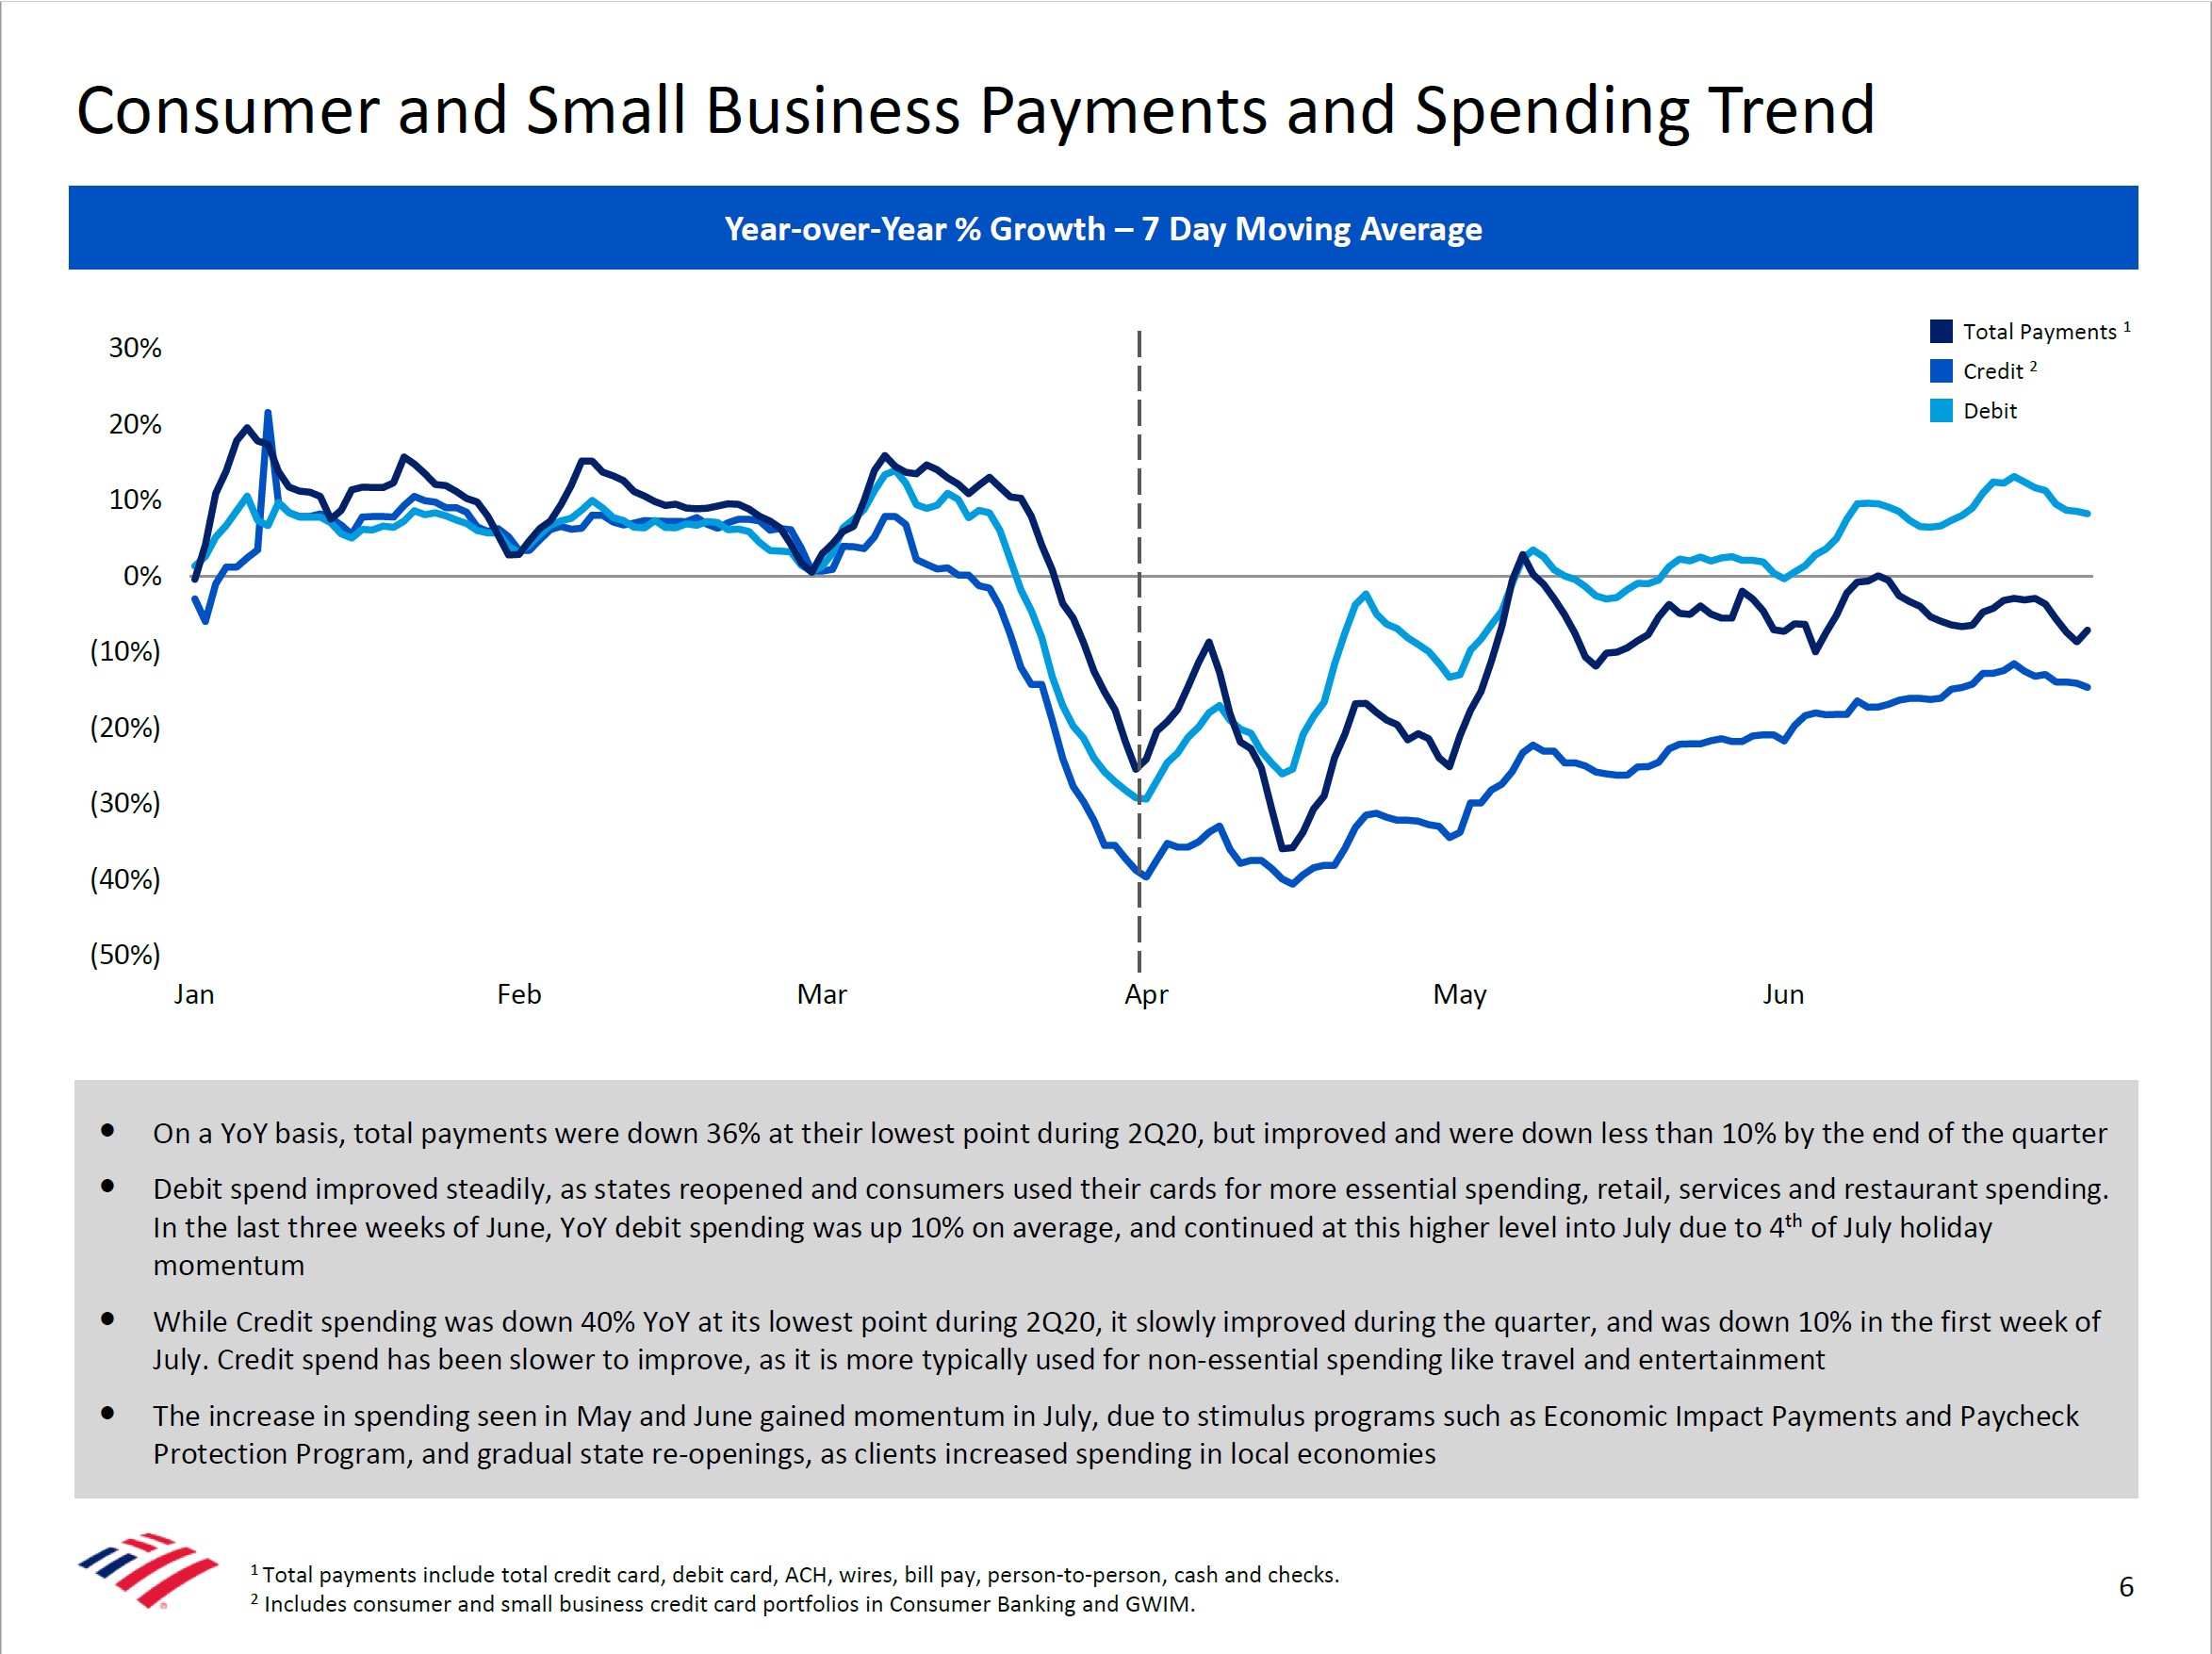
Image Shown: Bank of Consumer and Small Business Payments and Spending Trends show a nice bounce off of the April lows. Image Source: Bank of America 2Q2020 Earnings Presentation.
When putting all the puzzle pieces together, we see Bank of America facing the headwinds of low rates and sizable credit provisioning with relative ease thanks to its substantial pre-tax, pre-provision earnings power. As long as the economy doesn’t get drastically worse from here, long term investors will benefit from normalized valuations on more normalized earnings in the not-too-distant future. We're not interested in owning any bank at this time, however.
---
Valuentum members have access to our 16-page stock reports, Valuentum Buying Index ratings, Dividend Cushion ratios, fair value estimates and ranges, dividend reports and more. Not a member? Subscribe today. The first 14 days are free.
Matthew Warren does not own any of the securities mentioned. Some of the other securities written about in this article may be included in Valuentum's simulated newsletter portfolios. Contact Valuentum for more information about its editorial policies.
0 Comments Posted Leave a comment