Valuentum’s Weighted Average Cost of Capital (WACC) Distribution
The weighted average cost of capital is one of the most subjective measures in corporate finance, but it is also one of the most important ones.
"The most important item over time in valuation is obviously interest rates…If interest rates are destined to be at low levels…It makes any stream of earnings from investments worth more money. The bogey is always what government bonds yield….Any investment is worth all the cash you're going to get out between now and judgment day discounted back. The discounting back is affected by whether you choose interests rates like those of Japan or interest rates like those we had in 1982…When we had 15 percent short-term rates in 1982, it was silly to pay 20 times earnings for stocks." -- Warren Buffett, CNBC, May 17, 2018
By Brian Nelson, CFA
At Valuentum, we use an enterprise discounted cash flow valuation model to arrive at a fair value estimate and a fair value estimate range for every operating, non-financial company in our coverage universe (we use alternative methods of valuation for financial-related entities). Thus far, the results have been quite good, “How Well Do Enterprise-Cash-Flow-Derived Fair Value Estimates Predict Future Stock Prices? (pdf):”
Though academic research is scarce with respect to measuring the efficacy of discounted enterprise cash-flow-based fair value estimates due to the presence of price targets on Wall Street, the usefulness of a systematically-applied free-cash-flow-to-the-firm method remains intriguing. The study in this paper reveals a higher rate of price-to-fair value convergence for both undervalued and overvalued stocks, in aggregate (59%), as defined by the discounted enterprise cash flow process, than what otherwise might have been expected under “random walk” or efficient market theory.
Over the time period studied in this paper, stock prices have experienced a strong advance, and such a dynamic may have been expected to drive a higher frequency of price-to-fair value convergence in undervalued stocks (FV > P) than in overvalued stocks (FV < P). Such an occurrence was evident in the results. However, a statistically significant difference appeared with respect to undervalued stocks versus “random walk” expectations, and that a 40%+ price-to-fair value convergence rate for overvalued stocks occurred in a rising-tide-lifts-all-boats market environment was highly encouraging, if not equally intriguing.
In the incidence of fair value estimates that signaled undervaluation, the share price converged to the fair value estimate within eight time periods, or approximately 3 years, in more than 80% of the instances. Share prices of undervalued stocks advanced as much as 20% or 30%, on average, to achieve price-to-fair value convergence at this elevated cumulative price-to-fair value convergence rate. We think these statistics with respect to the identification of materially underpriced equities is remarkable under any economic conditions or market environment.
When it comes to enterprise discounted cash flow valuation, the discount rate, or the weighted average cost of capital, is one of the most important variables. From Warren Buffett’s preference to using the 30-year bond rate to the Capital Asset Pricing Model (CAPM) to other multi factor models (“Discounted Cash Flow Valuation: The Inputs” – Aswath Damodaran) that are used to estimate the discount rate, the measure is incredibly subjective, but that doesn’t mean the enterprise discounted cash-flow model itself holds little value to investors. Part of finance and intrinsic value estimation will always rest on the very real concept that the future is unpredictable, whether it is future expected interest rates (a driver behind the discount rate) or future expected revenue and operating earnings. This uncertainty is why we use a fair value estimate range in our work and only consider a company to be overvalued or undervalued when the price falls above or below the fair value range, respectively.
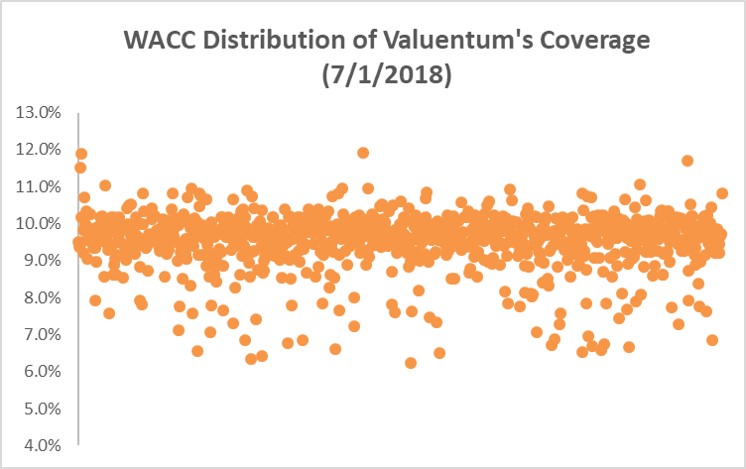
We utilize a fundamental version of the CAPM in our valuation framework, where we apply a fundamental beta to an estimate of the equity risk premium and add our forecast of the 10-year Treasury rate on a normalized basis. The theoretical component of the discount rate rests primarily in what an investor’s required return might be, that which ties future expected free cash flows back to today. We think many investors today have expected annual returns anywhere between 8%-12% over the long run, and from a top down standpoint, a distribution of our coverage universe’s weighted average cost of capital that mirrors those expectations seems most appropriate—the least fundamentally risky at the lower end, the most fundamentally risky at the higher end.
During the past many months, we have been finetuning our estimates of the weighted average cost of capital assumptions for a number of companies in our coverage universe. Part of the adjustment was driven by the new tax laws, which impact the after-tax cost of debt in the calculation, but we have been addressing head-on some of the pitfalls of even a fundamental CAPM framework that already attempts to “correct" for the quantitative shortcomings of beta. We use a fundamental beta ranking scale in our work to replace price-driven beta, but even so, it may make little sense within a fundamental CAPM framework for a financially-leveraged entity with material bankruptcy risk to have a lower cost of capital assumption than a financially-sound, net-cash-rich operation with negligible bankruptcy risk.
The mean (average) weighted average cost of capital assumption across equities in our coverage universe is ~9.5%. The way to think about that is generally in the form of baseline fundamental CAPM: ~4.3% long-term expected 10-year Treasury rate (a function of the spot rate and the historical average of the 10-year) and the long-term equity risk premium of 6.5% (1926-2008) and then the after-tax cost of debt, where we apply synthetic credit spreads above the 10-year Treasury on the basis of the firm’s credit quality (implied spreads based on corporate credit rating). Though this sounds like a lot of finance mumbo jumbo, in short, think about the mean (average) weighted average cost of capital assumption of ~9.5% as what investors are demanding as a required return on their investment, that which ties future free cash flows back to today.
As we continue to monitor the intrinsic values and cost-of-capital assumptions within our equity coverage universe, we have started to give debt-free companies a benefit to their cost of equity assumptions, a component of the weighted average cost of capital, in light of the fact that the CAPM generally may be too punitive on these debt-free organizations as the after-tax cost of debt is definitionally lower than the cost of equity (stocks with high levels of debt may theoretically have lower cost of capital assumptions, but this may not always make sense practically). In any case, when reviewing our valuations, we always ask whether the weighted average cost of capital assumption makes sense relative to that of the average of our coverage universe. Is this company’s fundamental risk to our estimate of future expected cash flows below-average risk (<9.5%), about average risk (~9.5%), or above-average risk (>9.5%). Where in the past we've been hesitant to make major adjustments to discount rate assumptions, readers should expect ongoing finetuning with respect to the weighted average cost of capital assumption (and its underlying constituents, save the risk-free rate) as we seek to more appropriately value fundamental financial risk across our coverage.
Tickerized for operating companies in our coverage universe.
--------------------------------------------------
Valuentum has developed a user-friendly, discounted cash-flow model that you can use to value any operating company that you wish. Click here to buy this individual-investor-friendly model now! It could be the best investment you make.
-----
Valuentum members have access to our 16-page stock reports, Valuentum Buying Index ratings, Dividend Cushion ratios, fair value estimates and ranges, dividend reports and more. Not a member? Subscribe today. The first 14 days are free.
Brian Nelson does not own shares in any of the securities mentioned above. Some of the companies written about in this article may be included in Valuentum's simulated newsletter portfolios. Contact Valuentum for more information about its editorial policies.
0 Comments Posted Leave a comment