Taking a Bite Out of Apple
Summary:
Apple's revenue and earnings per share were largely in-line with expectations in the fourth quarter of fiscal 2016.
Revenue guidance may have come in a little light relative to consensus expectations, and expansion in China appears more challenging than originally thought.
A recent product safety issue at Samsung has opened the door for Apple to convert potentially millions of smartphone users to loyal Apple customers.
We're still huge fans of Apple, its products, free cash flow generation, and pristine balance sheet -- not to mention its dividend growth prospects (bottom of article)!
By The Valuentum Team
Oh, another article on Apple, you may say. Well, here's why this one is different. We'll cover some recent developments, of course, but we have a pretty robust DCF-derived fair value estimate to share, and you just have to check out how we think about Apple's dividend, too (it's at the bottom of the article, so be sure to read the whole thing). All in this piece and more! It's not your run-of-the-mill, he-said she-said Apple article. This one is drenched in deep analysis. Let's go!
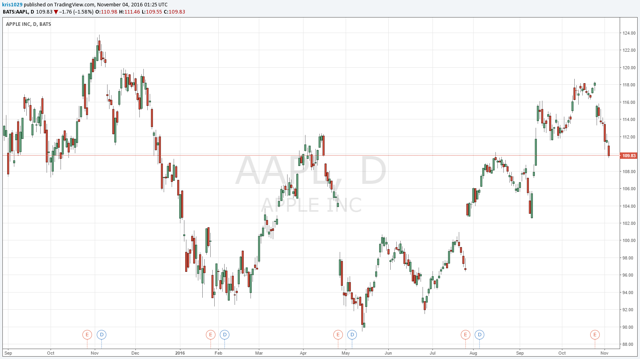
Apple's (AAPL) revenue and earnings per share were largely in-line with expectations in the fourth quarter of fiscal 2016, report released October 25, but all key products segments experienced declining units sold, with the largest decline witnessed in Macs (down 14%); services revenue was the bright spot at 24% year-over-year expansion. We're not reading much into management's projections for its fiscal first quarter of 2017, where revenue is targeted at $76-$78 billion, gross margin at 38%-38.5%, and operating expenses at $6.9-$7 billion.
Revenue guidance may have come in a little light relative to consensus expectations, and expansion in China (FXI) appears more challenging than originally thought, but the company's gross margin rate is still quite healthy. The latest iteration of the iPhone, the iPhone 7 and iPhone 7 Plus, remain in high demand, and rumors about an "Apple car" and "Apply TV" continue to swirl. The company's AirPods are highly-anticipated, though opinions vary.
Brand loyalty is a key advantage in a consumer facing end market, and Samsung (SSNLF) appears to have damaged, at least to a degree, its level of trust with consumers with its recent Galaxy Note 7 debacle in which the smartphones were recalled not once but twice. Apple has a chance to convert millions of former Galaxy users into loyal Apple consumers. In addition to the share growth potential in the smartphone market, Apple stands to benefit from a boost in its installed base of users, making its ecosystem increasingly stronger as its competitor suffers.
Though we're never happy when consumers are put at risk by failing products as was the case with the Samsung developments, we love what the recent developments surrounding Apple's largest rival mean for the tech giant's long-term positioning in the smartphone market. We're happy to have held on to our positions in Apple in both newsletter portfolios throughout weakness in shares and negative sentiment that has surrounded the stock for a large portion of 2016, and we will continue to do so for the foreseeable future.
Apple's Investment Considerations
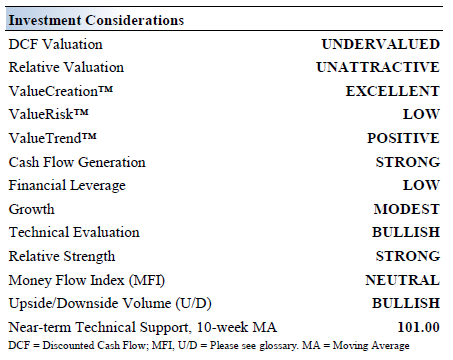
Image source: Valuentum
Investment Highlights
• Apple is as much a brand as it is one of the world's most innovative companies. The firm is no longer known for its iPods and personal computers, as the proliferation of the iPhone over the past several years has been a sight to behold. The company's execution remains top notch, and we expect it to continue to roll out innovative products in smartphones and wearable technology, its most recent major product launch.
• Criticism over the firm's dependence on sales of the iPhone gained momentum in fiscal 2016, as the second quarter of the fiscal year marked the first quarterly sales decline in 13 years. High levels of demand for the iPhone 7 and multiple safety issues at rival Samsung have eased concerns for the time being.
• Apple's rollout of future iterations of the iPhone should propel its fundamentals higher. Though we're not embedding another blockbuster hit in our model, we wouldn't be surprised if Apple delivers another one from its pipeline. Perhaps only a dream five years ago, the popularity of the new Apple Watch is now worth watching, though it has yet to catch fire in the eyes of consumers.
• Apple's cash hoard is more than some of the market capitalizations of the largest companies in the S&P 500. The company retains tremendous flexibility in this regard, and we continue to expect dividend increases and share buybacks.
Business Quality
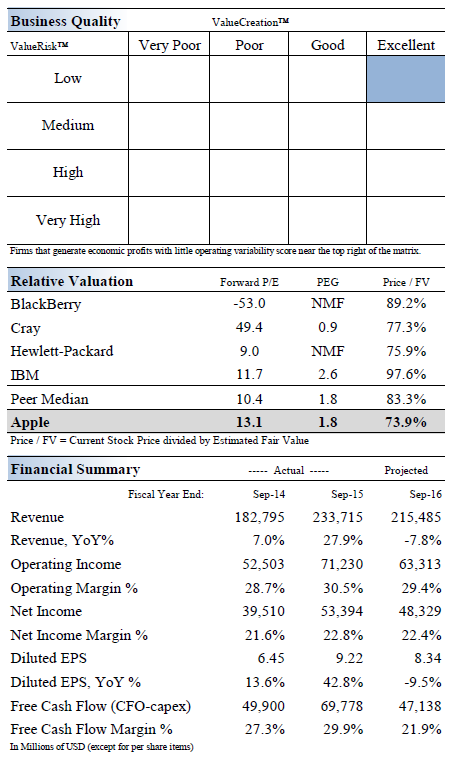
Image source: Valuentum
Economic Profit Analysis
In our opinion, the best measure of a firm's ability to create value for shareholders is expressed by comparing its return on invested capital with its weighted average cost of capital.
The gap or difference between ROIC and WACC is called the firm's economic profit spread. Apple's 3-year historical return on invested capital (without goodwill) is 183.1%, which is above the estimate of its cost of capital of 10.2%. As such, we assign the firm a ValueCreation™ rating of EXCELLENT.
In the chart below, we show the probable path of ROIC in the years ahead based on the estimated volatility of key drivers behind the measure. The solid grey line reflects the most likely outcome, in our opinion, and represents the scenario that results in our fair value estimate.
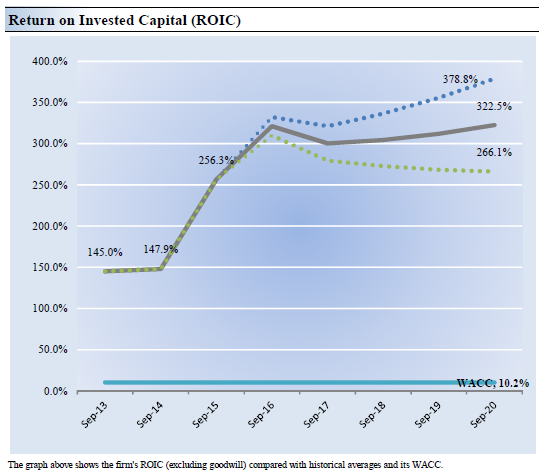
Image source: Valuentum
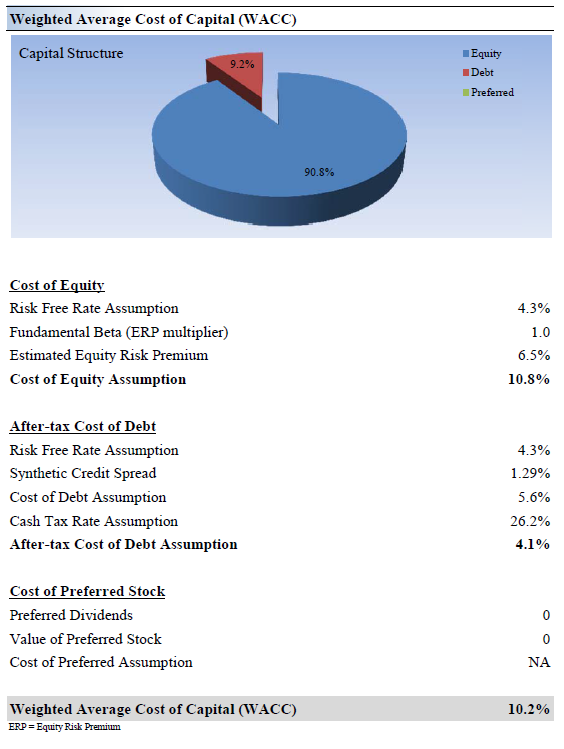
Image source: Valuentum
Cash Flow Analysis
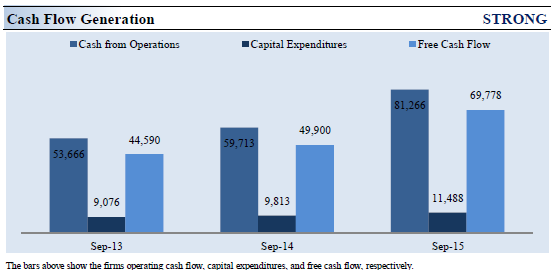
Image source: Valuentum
Firms that generate a free cash flow margin (free cash flow divided by total revenue) above 5% are usually considered cash cows. Apple's free cash flow margin has averaged about 27.7% during the past 3 years. As such, we think the firm's cash flow generation is relatively STRONG.
The free cash flow measure shown above is derived by taking cash flow from operations less capital expenditures and differs from enterprise free cash flow (FCFF), which we use in deriving our fair value estimate for the company. At Apple, cash flow from operations increased about 51% from levels registered two years ago, while capital expenditures expanded about 27% over the same time period.
Valuation Analysis
We think Apple is worth $148 per share with a fair value range of $121-$175.
The margin of safety around our fair value estimate is derived from an evaluation of the historical volatility of key valuation drivers and a future assessment of them. Our near-term operating forecasts, including revenue and earnings, do not differ much from consensus estimates or management guidance. Our model reflects a compound annual revenue growth rate of 1.1% during the next five years, a pace that is lower than the firm's 3-year historical compound annual growth rate of 14.3%.
Our model reflects a 5-year projected average operating margin of 31.4%, which is above Apple's trailing 3-year average. Beyond year 5, we assume free cash flow will grow at an annual rate of 2.1% for the next 15 years and 3% in perpetuity. For Apple, we use a 10.2% weighted average cost of capital to discount future free cash flows.
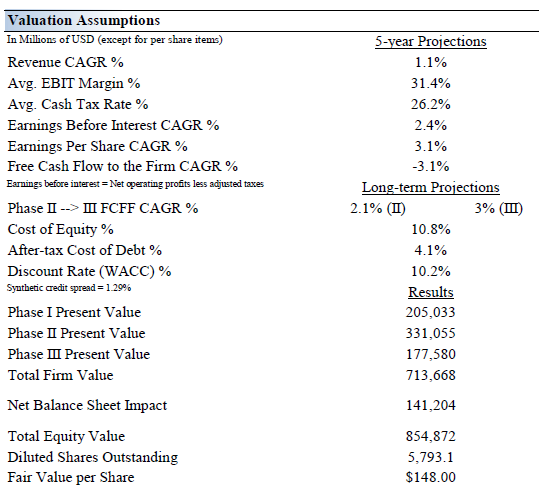
Image source: Valuentum
(click to enlarge)
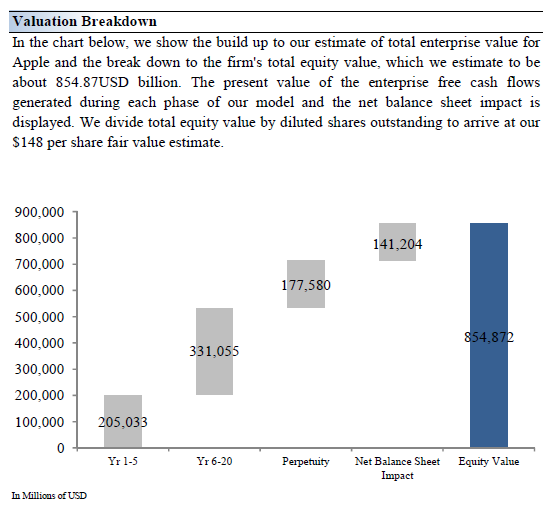
Image source: Valuentum
(click to enlarge)
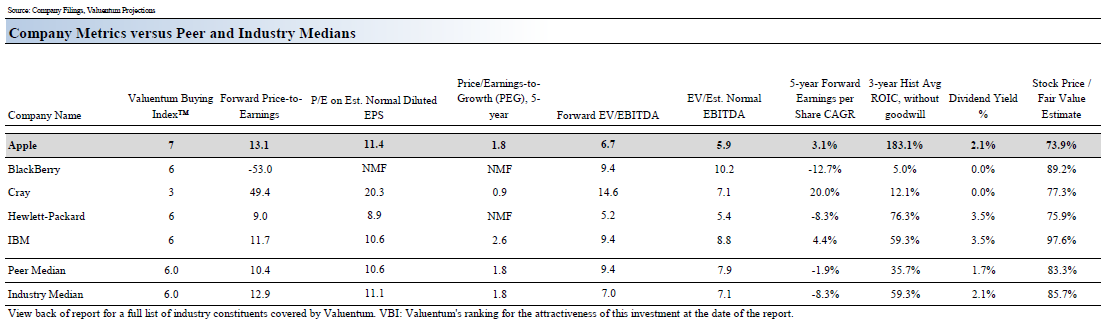
Image source: Valuentum
Margin of Safety Analysis
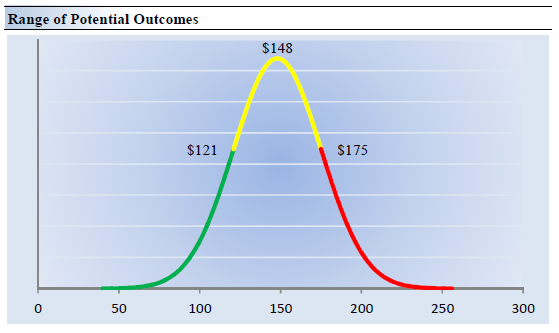
Image source: Valuentum
Our discounted cash flow process values each firm on the basis of the present value of all future free cash flows. Although we estimate the firm's fair value at about $148 per share, every company has a range of probable fair values that's created by the uncertainty of key valuation drivers (like future revenue or earnings, for example). After all, if the future were known with certainty, we wouldn't see much volatility in the markets as stocks would trade precisely at their known fair values.
Our ValueRisk™ rating sets the margin of safety or the fair value range we assign to each stock. In the graph above, we show this probable range of fair values for Apple. We think the firm is attractive below $121 per share (the green line), but quite expensive above $175 per share (the red line). The prices that fall along the yellow line, which includes our fair value estimate, represent a reasonable valuation for the firm, in our opinion.
Future Path of Fair Value
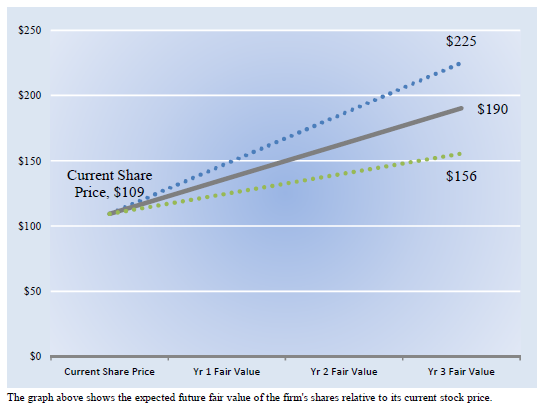
Image source: Valuentum
We estimate Apple's fair value at this point in time to be about $148 per share. As time passes, however, companies generate cash flow and pay out cash to shareholders in the form of dividends. The chart above compares the firm's current share price with the path of Apple's expected equity value per share over the next three years, assuming our long-term projections prove accurate.
The range between the resulting downside fair value and upside fair value in Year 3 represents our best estimate of the value of the firm's shares three years hence. This range of potential outcomes is also subject to change over time, should our views on the firm's future cash flow potential change.
The expected fair value of $190 per share in Year 3 represents our existing fair value per share of $148 increased at an annual rate of the firm's cost of equity less its dividend yield. The upside and downside ranges are derived in the same way, but from the upper and lower bounds of our fair value estimate range.
About Apple's Dividend Health
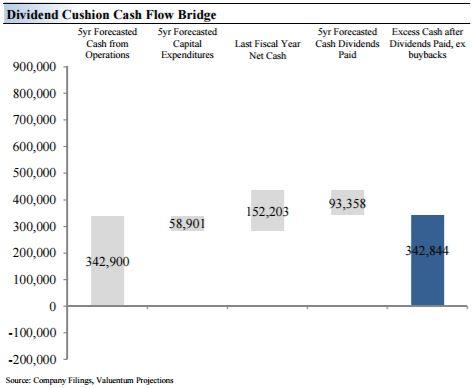
Image source: Valuentum
Key Strengths
Along with being one of the most innovative companies, Apple boasts unparalleled brand strength, giving it a material competitive advantage. We love what it has built through its ecosystem of apps and the presence it has in the everyday lives of consumers. A core tenet of Apple's investment thesis, and its dividend strength, is its massive net cash position, which stood at nearly $147 billion at the third quarter of fiscal 2016. The company's tremendous free cash flow generation allows such a position to proliferate while continuing to pay a growing dividend. It averaged more than $55.2 billion in free cash flow from fiscal 2013-2015, well in excess of annual runrate cash dividend obligations of ~$11.6 billion.
Potential Weaknesses
With a Dividend Cushion ratio well above 4, we have a difficult time finding large drawbacks in Apple's dividend growth profile. Sales have experienced some pressure in recent quarters, but any transient weakness in the firm's operational performance should not impact dividend health in the near term thanks to its tremendous cash hoard. Competing capital allocation options have the potential to impact the pace of dividend expansion moving forward, specifically through strategic acquisitions of differentiated technology and share repurchases. Buybacks averaged more than $34 billion from fiscal 2013-2015. We're not particularly fond of Apple's growing debt position, but it is far from a concern at this point in time thanks to its cash balance.