The Correction: Surveying the Marketplace in 3 Charts
For those just joining us, we’ve been profiling the market’s recent slide under the article series titled, The Correction. This article is the latest installment of the series.
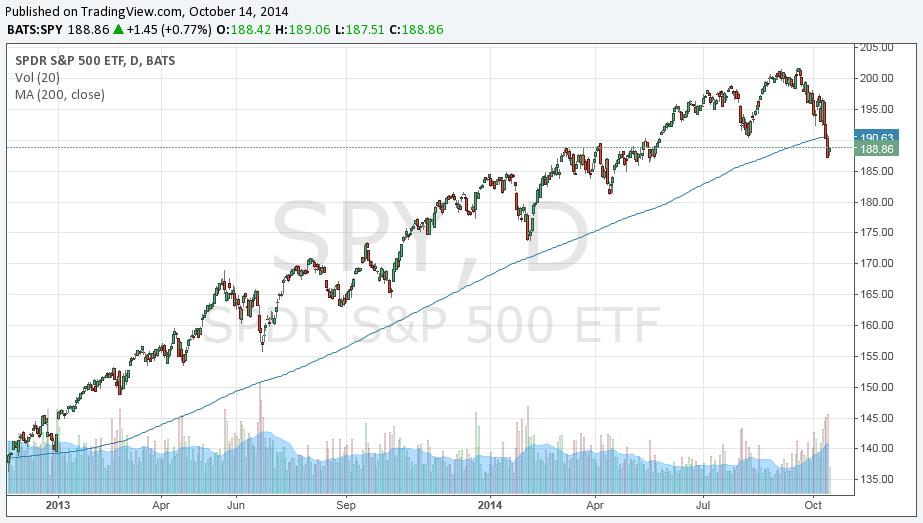
SPDR Select S&P 500 (SPY) Breaks Below 200-day Moving Average
You can say what you want about technical analysis, but times have changed since strict fundamentalists started publishing that chart reading is taboo. There are industry veterans who grew up with the markets decades ago that still don’t buy into the discipline, but technical analysis has become a much-needed skill at any level.
Why?
Well, the more technicians and chart-followers there are, the more the markets behave according to that particular discipline. Remember: stock prices are driven by buying and selling of shares. If long-term investors aren’t doing a lot of buying and selling, then the technicians, who are doing a lot of buying and selling, are moving the markets in the near term—and they’re moving the markets according to how they see the charts developing.
The big technical move that happened this week was a breach below the 200-day moving average by the S&P 500 Select SPDR. Why does this matter? Well, what was once support is now resistance. Why? Because the technicians said so. Why is what they say important? Because they drive the market in the near term. Recent studies have shown that, while this indicator is not perfect, usually when the 200-day moving average on the S&P is breached, stocks underperform going forward relative to other time periods.
Our view is that the S&P 500 will inevitably test 1900-1910, the 200-day moving average, very soon. If we break through 1920 to the upside, there may still be hope yet that this bull market is not yet over. However, it is probable that the worst of the declines are still ahead of us. The 200-day moving average could now dictate where the markets will go for the next couple years, so it is worth paying very close attention to it. Sorry for the lengthy technical stuff, but I just want to make sure you aware of the important goings-on, even if they are more technical in nature.
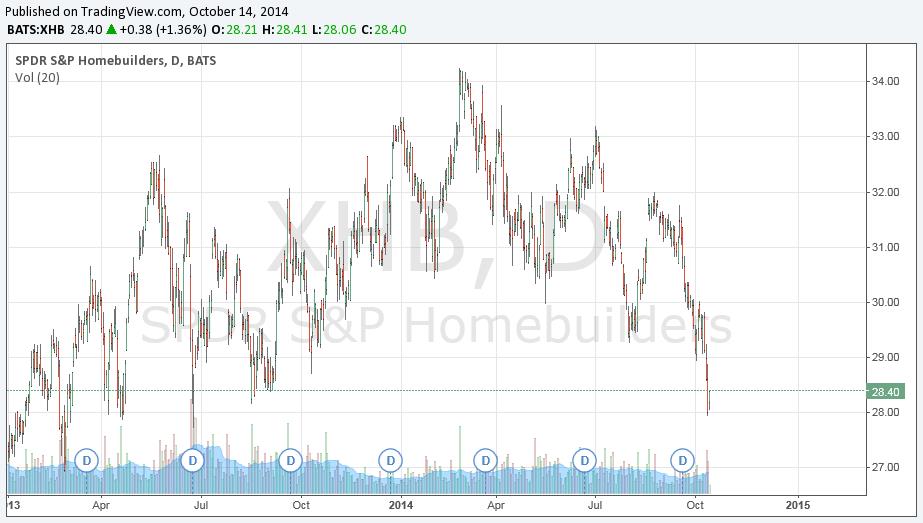
SPDR S&P Homebuilders (XHB) Erases 2013 gains
Frankly, there’s something wrong with the mortgage sector when Ben Bernanke can’t refinance his own personal mortgage. After all, the man was pretty much the architect behind saving the global economy during the depths of the Financial Crisis. If the banks won’t give the former chairman of the Federal Reserve a loan, then the banks are certainly choking off economic activity. But is it really the banks’ fault?
Not in our view. Excessive regulations coupled with steep penalties for making any sort of loan that doesn’t meet strict criteria is to blame. Chalk one up to the US government for why the housing market could be heading south again in a hurry. Aside from the diversified banking ETFs—(XLF, KBE) we don’t hold any one company particularly levered to the housing markets. We’re not ready to do some bottom-fishing just yet, if only because we know what a true bottom in housing looks like (and it’s not pretty).
CBOE Volatility Index (VIX) Has Hit 2-Year Highs But The Market Is Still Not Fearful
The talking heads like to call this index the fear index. The VIX, shown below, is a popular measure of the implied volatility of S&P 500 index options, the ones that we recently closed out for large gains in the newsletter portfolios. Specifically, the VIX represents that market’s expectation of stock market volatility over the next month (30-day period).
The bad news is that we’ve broken out to a new 2-year high on the VIX. The terrible news is that in the context of the past several years, the market is so far away from being fearful that we can only say that the markets are still in ‘greedy’ territory…and when the markets are greedy, it’s time to…at least…be cautious.
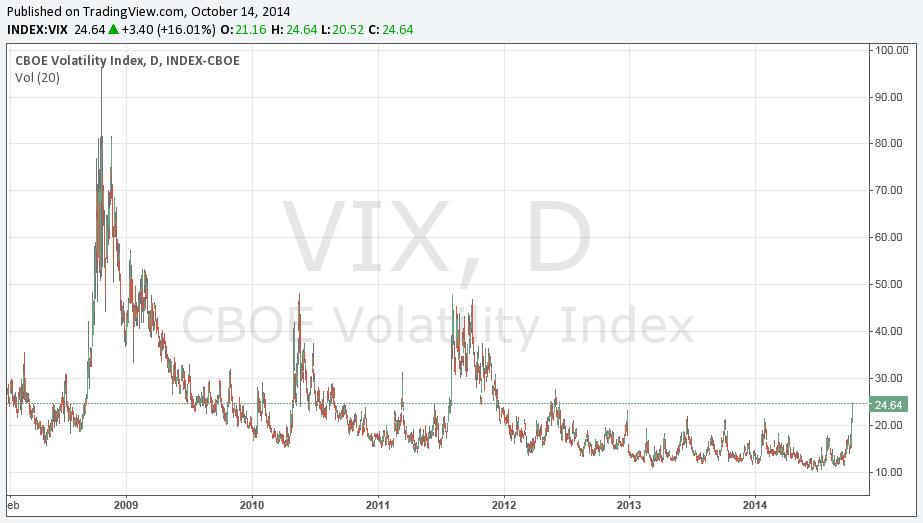
The move lower by the broader equity markets during the past couple weeks may seem like a painful move, but just a glance at the VIX (above) shows that things could get a lot worse. The past few weeks have been but a blip on the fear index. We think investors should prepare themselves for more tough sledding. We’re watching the markets bounce a bit Tuesday, but that’s not enough for us to throw caution to the wind and load up on equities at the moment. Please expect the daily market commentary to continue.